

Hardware components | ||||||
| × | 1 | ||||
| × | 1 | ||||
 |
| × | 1 | |||
Software apps and online services | ||||||
 |
| |||||
 |
| |||||
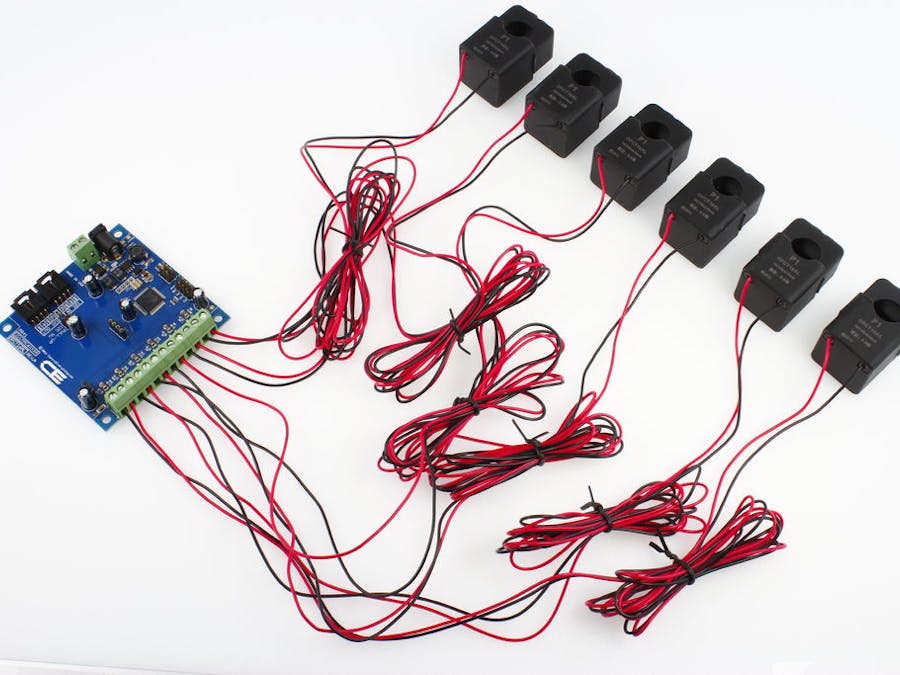
Since last few weeks i was thinking about making a project which can help me in keeping a track on my daily energy usages. In this project i am using a 30A current monitoring board. this board has 6 current sensor which can read upto 30A current. this board comes with an I2C interface and has 4 address lines so you can hookup up to 16 boards on the same I2C master device, which will give you total 96 current monitoring sensors.
To read the current and power calculation I am using an arduino nano with an I2C adapter. This I2C adapter makes easy to connect current monitoring board.
I will also explain how you can write data into an xl sheet and in a google sheet using Arduino.
Hardware you need:
3. I2C cable
Step 1: Power monitoring using arduinoLets start with Arduino code. In this code I will write a command to read current through I2C. This code is pretty straight forward, all you need to do is send a command to read current and the Current monitoring board will do everything for you. In my area the AC voltage is around 120-124V. we will use this voltage reading to calculate the power uses.
In this code I am calculating current, power, watt hour, total watt hour and total kilo watt hour.
//Include Wire I2C Library
#include
int address = 42; // I2C address
double voltage = 121.7;   //////// voltage reading
double tkWh = 0;
double tWh = 0;
void setup()
{
 Serial.begin(9600);  // Create Serial Object (9600 Baud)
 Wire.begin();
}
void loop()
{
   Wire.beginTransmission(address); // Start communication
   Wire.write(146); // Command header
   Wire.write(106); // Command header
   Wire.write(1);  // Command 1
   Wire.write(1);  // Start Channel no
   Wire.write(1);  // End Channel no
   Wire.write(0);
   Wire.write(0);
   Wire.write((146 + 106 + 1 + 1 + 1 + 0 + 0) & 255); // CheckSum
   Wire.endTransmission(); // Complete Transmission
   Wire.requestFrom(address, 5);
  unsigned long MSB1 = Wire.read();
    MSB1= MSB1*65536;
   unsigned long MSB = Wire.read();
   MSB=MSB*256;
   unsigned long LSB = Wire.read();
   MSB1=MSB1+MSB+LSB;
   double current = ((double)MSB1)/(double)1000;


   Serial.print(current,3); //// current on ch 1
   Serial.print(",");
   double Power = voltage * current;  /// power on ch1
   Serial.print(Power,3);
   Serial.print(",");
   double Wh = 0.000833 * Power;  /// Watt hour on ch1
    Serial.print(Wh,4);
   Serial.print(",");
   tWh = tWh + Wh;   /// total watt hour used
   Serial.print(tWh,4);
   Serial.print(",");
    tkWh = tWh/1000;  /// total kilo watt hour used
   Serial.print(tkWh,4);

   Serial.print("\n");
   Wire.endTransmission(); // Complete Transmission

 delay(3000);
}
After reading the current now we will calculate the power. Power calculations are done in this section of the code. All you need to do is burn the code in Arduino and check your readings on serial port.
Serial.print(current,3); //// current on ch 1
  Serial.print(",");
   double Power = voltage * current;  /// power on ch1
   Serial.print(Power,3);
   Serial.print(",");
   double Wh = 0.000833 * Power;  /// Watt hour on ch1
    Serial.print(Wh,4);
   Serial.print(",");
   tWh = tWh + Wh;   /// total watt hour used
   Serial.print(tWh,4);
   Serial.print(",");
    tkWh = tWh/1000;  /// total killo watt hour used
   Serial.print(tkWh,4);
Just for the testing purpose i changed to a different different load just to see if it works with other load, so far it worked great. You can also find the code on git.
Step 4: Writing data in a text file using Arduino and CoolTermTo write data into a text file I am using CoolTerm, it's a really simple tool for capturing data. To setup cool term:
1. Download coolterm
2. Go to connection >> option
3. Select serial port >> port
4. Go to connection >> capture to text file
Once you setup this it will start writing all the data coming from the Arduino into a text file. We will use this data to plot power usages graph.
Step 5: Creating XL sheet using Arduino dataCoolTerm will save all data in a local folder and you can import this file into a XL sheet. I separated different readings with a "," so that I can create tables into the XL sheet. I will suggest if you have multiple data, do the same.
Step 6: Google sheet using ArduinoNow we will import the Arduino data into a Google Sheet. Its a very simple process, please follow these steps:
- Open Google
- Go to Google Sheet
- Create a new Google Sheet
- Go to file import and select your Arduino o/p text file
After doing this, Google will create a Google sheet.
Step 7: Power monitoring graph using Arduino and Google SheetOnce you have your data imported now you can start drawing graph. To draw graph please do this.
- Select row 2, 3, 4
- Go to insert and select graph
Here you can choose different different graph plots according to your choices.
Step 8: MiscellaneousWith this product you can keep track on your daily power usages, monthly power usages and plan your power usages according to that. You can also track if there is any devices which is taking too much power.


Comments