


Hardware components | ||||||
| × | 1 | ||||
| × | 1 | ||||
| × | 5 | ||||
| × | 1 | ||||
| × | 1 | ||||
Software apps and online services | ||||||
 |
| |||||
Or how many particles were counted?
IntroductionThis note is a continuation of a series of articles to introduce the use of very simple sensors and motors for self-study exercises. The base platform for these articles is the Elegoo Starter Kit. This specific note focuses on an inexpensive air quality sensor that has been in popular use for several years. The air quality sensor is available worldwide but it is not an integral component in the original Starter Kit.
The note examines some of the basic and generic options for data acquired from typical sensors. It is not practical to examine all the options in a single note. It is however the intent to illustrate the essential steps of these diverse techniques in a series of forthcoming notes. However, before we get ahead of ourselves, let us review the sensor that will the subject of the current note.
Particle SensorShinyei Technology is the original manufacturer of the particle sensor unit, PPD42NJ. While a new an improved model is now presently available, for the limited purpose of an introductory exercise, the older model will suffice.
ApplicationsSuitable applications for the particle sensor include but not limited to:
- Air purifier
- Air quality monitor
- Air conditioner
- Ventilator
- Smoke
- Pollen count
- Dust
- Soot
- Home healthcare
- Allergen detection
- Gas leak detection
The key features of this sensor are:
- High sensitivity, stable
- Digital output, simple interface
- Good for indoor detection of:
- Pollen
- Spores
- Allergens
- Bacteria
- Settling dust
- Smog
- Tobacco
- Self-aspiration, compact and low maintenance
The manufacturer’s datasheet (see references section) lists the following specifications.
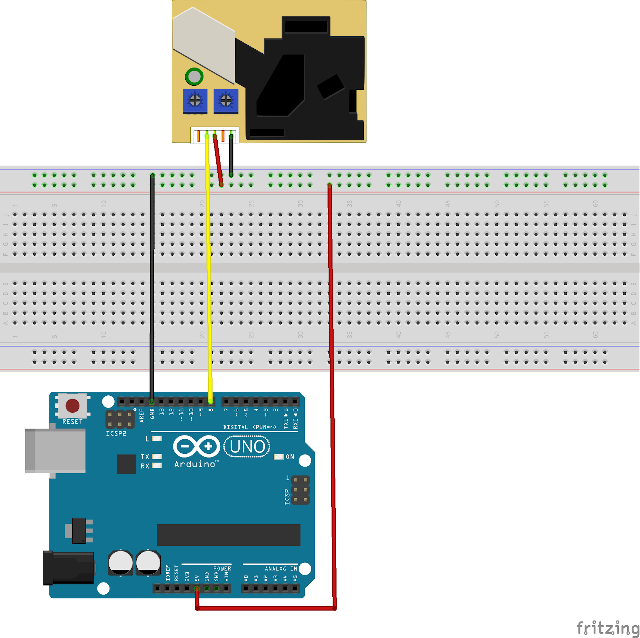
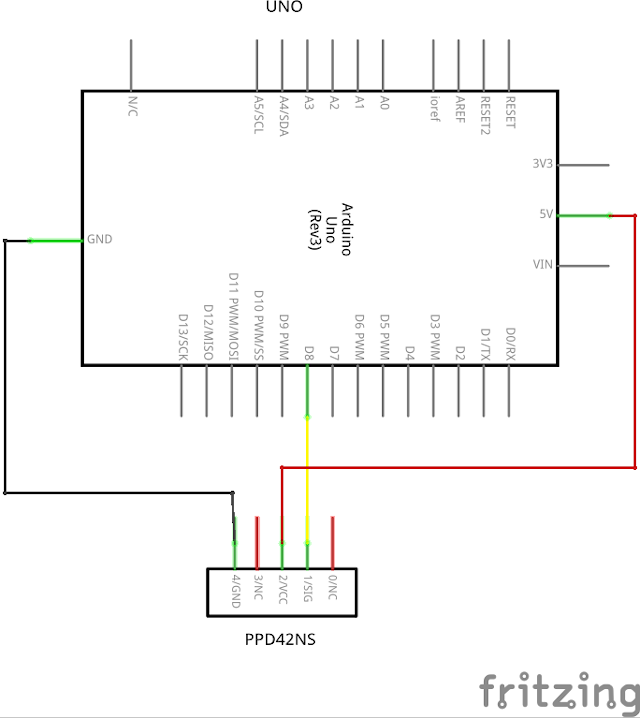
The following table summarizes the default pin connections for the sensor:
1 Black GND
2 unused for P2 signal
3 Red 5 V DC
4 Yellow for P1 signal
5 unused for T1 to set threshold for P2
The number convention for the pins in the above image of the sensor follows from right to left. Pin 1 is on the right and Pin 5 is on the left. The signal pins do not require an external pull up resistor.The internal pull up resistance is around 10 kΩnominally.
The use of the two potentiometers is beyond the scope of this article.
OperationsThe stabilization time for the sensor is approximately 1 minute after the application of power through the specified pins. The figure below(courtesy: Shinyei Technology, the sensor manufacturer)illustrates the operations at a summary level:
The particulate presence is estimated from the summation of the measured low pulse width over a sampling period of approximately 30 seconds.The low pulse width is proportional to particulate matter size and concentration. The range for the low pulse width is between 1 to 300ms (i.e. low voltage < 0.7 V DC).
CalculationsThe basic calculation procedure is as follows:
For the Arduino solution, the unit for the low pulse width value is microsecond. This value may vary from 1 to 300 microseconds. The conventional sample period is 30 seconds.
The classic equation (as proposed by Chris Nafis through regression analysis of a chart published by Shinyei Technology) has stood the test of time as follows:
The correlation of the small particulate matter concentration to an Air Quality Index is beyond the scope of this article since the Shinyei PPD42NJ dust sensor does not detect gaseous (CO, O3, NO, NO2 & SO2) concentrations. Also, the manufacturer’s charts do not account for the dramatic variability when converting particle counts to particle mass for different classes of matter.
BackgroundThis note is a very practical activity for a quick introduction to simple observation activities. The scope for the current document is very limited but can be easily extended for other tasks that will promote more interest in electronics, science and related technical skills. The choice of a suitable enclosure with expansion capabilities will undoubtedly lead to further ideas on monitoring the ambient conditions for weather, security and related observations for downstream mining of copious telemetry data.
The sensor chosen for this exercise counts the fine (~ 1 µm)particles using a very simple geometrical arrangement. The number of particles counted during a fixed sampling interval (30 secs) provides the basis for the estimation of the concentration.
The conversion of a chart published sensor manufacturer’s datasheet manner to an empirical equation for the corresponding concentration value was conducted by Chris Nafis many years ago and seems to have stood the test of time. Nobody (in published literature) has proposed an alternate set of coefficients for the polynomial. Even other low-cost sensor manufacturers seemed to have piggy-backed this equation to the exact decimal digits.
Air Quality IndexThe reader is directed to the references section of this note for further readings on air quality index. Dylos Corp uses an empirical table to map the particulate count (from its monitoring devices) to indoor air quality. This table is printed on their products.
LibraryThe following standard Arduino library calls support the program:
- Serial
- pulseIn
- millis
The Serial library supports communication between the Arduino board and another system which is generally a host computer.
pulseInThe pulseIn function is part of the Arduino advanced I/O library. It returns the duration of a complete pulse at a designated state (HIGH or LOW) between transitions. The unit for the returned value is microseconds. The value may range from 10 µs to 3 minutes approximately. A value of zero is returned if the timeout value is breached.
millisThe function returns the time passed since the current program started.
The simplest project to demonstrate the use of this device is to simply read the value and to echo it in a run-time window using the Serial library functions:
- Serial monitor
- Serial plotter
All projects in this introductory set of basic and elementary projects, the microcomputer board and the breadboard are mounted on a base-plate. This technique has been illustrated in a previous project and for the sake of brevity will not be repeated here.
Care should be exercised in mounting the dust sensor. The orientation of the sensor is important obviously owing the operational principles. Also interference from ambient light may affect the readings. No external light should be directed to the chamber where the particles are detected by the LED. For this purpose mounting inside a box with open vertical sides may provide more stable readings as well as provide an interference barrier for ambient light. Explorations of these arrangements is best suited for individual needs and beyond the scope of this article.
Display dataThe data can be displayed in one of the following modes:
- Terminal line output
The following figure illustrates a typical terminal line output from the introductory (running ppd42ns-01.ino) code.
The print function in the Arduino Serial library merits parametric evaluation for more custom versions of serial line output in theterminal window. To convert the volumetric measurement from cubic feet to cubic meter, multiply the value by the conversion factor of 35.3147. Assuming, that particles are less than 2.5 micron in size(using P1 readings) then the straightforward multiplication of the value will suffice for demonstration purposes.
- Chart plot
The chart plot (running ppd42ns-02.ino) requires numerical values to be written to the serial line (using the print function)simply. After uploading the code to the board, in the Arduino IDE menu bar, select Tools and from the cascade menu select Serial Plotter. A window similar to the one shown below will display.Allow a few minutes for the data to start the render of data as a line chart in near real time.
The above plot is interesting for two reasons:
- The initial operation was relatively at steady state
- A step change in the indoor air was introduced for several minutes (in the adjoining kitchen!) at which point the particulate matter count spiked up. As soon as the change was removed, the count started dropping with a clear trend towards status quo ante.
Ideally one should use post-processing for such time series data(e.g. various moving averages, correlation with other sensor data) as practical with applications. While there is no reason why some of these number crunching tasks cannot be done in the Arduino UNO, conventionally it is more pragmatic to conduct these operations on a host computer where more scalable tool-chests are readily available. The following section is yet another introductory example to illustrate the path going forward in the most elementary and simple manner.
Read dataReading the data from the Arduino UNO via the serial port requires a processing program on the host computer. This program, for the limited purposes of this note, is illustrated using two languages:
- Python
- C++
The Python example leverages the popular pySerial and standard libraries to read data from the serial port and to write it to a text file for external use.
Serial portsThe following command and corresponding output illustrates one way to enumerate all accessible serial ports:
$ python3 -m serial.tools.list_ports
Another simple command that may require some interpretive filtering is:
$ ls /dev/tty*
The output from the program is shown below for a general run:
478.44
207.96117.26
0.62
0.62
47.30
180.74
0.62
124.07
90.11
146.02
148.27
12.28
3.40
296.86
The Arduino program is the same one that was used to illustrate the Serial Plotter window. The Python program reads the serial data and writes it to a file.
C++The key reason for demonstrating the C++ equivalent program is that it can serve as the basis for extensions that are mentioned at the end of this article. Otherwise, basic ncat operations can perform the same functions with fewer hurdles.
The data collected by either of these methods can be aggregated for24-hour averages that are required for more complex computations for air quality index.
Node-RedThe best solution to orchestrate data flow for IoT networks is to leverage Node-RED. The figure below is a very simple example that eliminates the need to write any code (i.e. Python or C++ as mentioned above) and to simply drag, drop, connect and configure widgets:
The output on the debug pane is identical (in context but, of course, not in numerical values) to that read by the Python or C++ programs. No procedural code was written for the Node-RED example.
The Next StepsThe starter programs (in Python and C++) can serve as the basis for further exercises in telemetry. The extension options are illustrated in the figure below.
Stay tuned for the articles illustrating other logging techniques in greater detail.
ReferencesAir Quality Data Collected at Outdoor Monitors Across the US
Air Quality Index (AQI) Basics
De-construction of the Shinyei PPD42NS dust sensor
Laboratory Evaluation of the Shinyei PPD42NS Low-Cost Particulate Matter Sensor
ShinyeiPPD42NS particle sensor has >1um and >2.5um channels!
Video demonstration (under preparation)


Comments