

Hardware components | ||||||
 |
| × | 1 | |||
 |
| × | 1 | |||
 |
| × | 1 | |||
 |
| × | 1 | |||
Software apps and online services | ||||||
 |
| |||||
| ||||||
| ||||||
| ||||||
| ||||||
I got a problem to solve for a project using the Internet of Things. The problem statement asks to build a temperature monitoring system for a pharmaceutical company for them to monitor the temperature of their medicine storing facility as directed by the government.
So I built the temperature monitoring system using Bolt module that uses machine learning to detect any anomaly and notify the same via an e-mail.
Here the system using machine learning, predicts the temperature for next 20 minutes so the required action could be taken even before the any actual unwanted situation comes.
Also using Python's powerful libraries and features, any anomaly is detected if the door is opened and an email is automatically sent if the temperature crosses the threshold.
Building the projectStep 1:
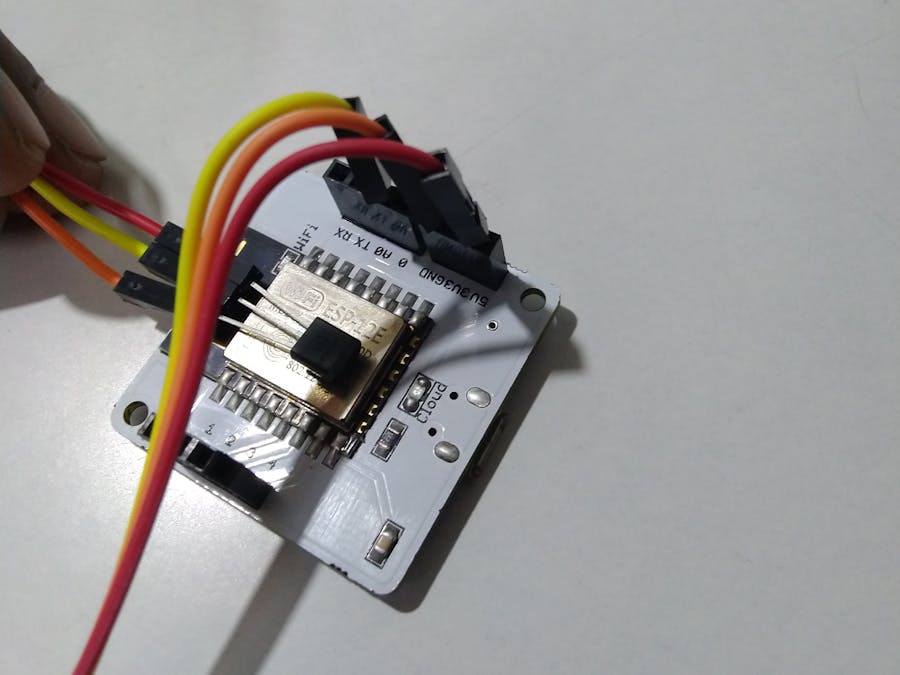
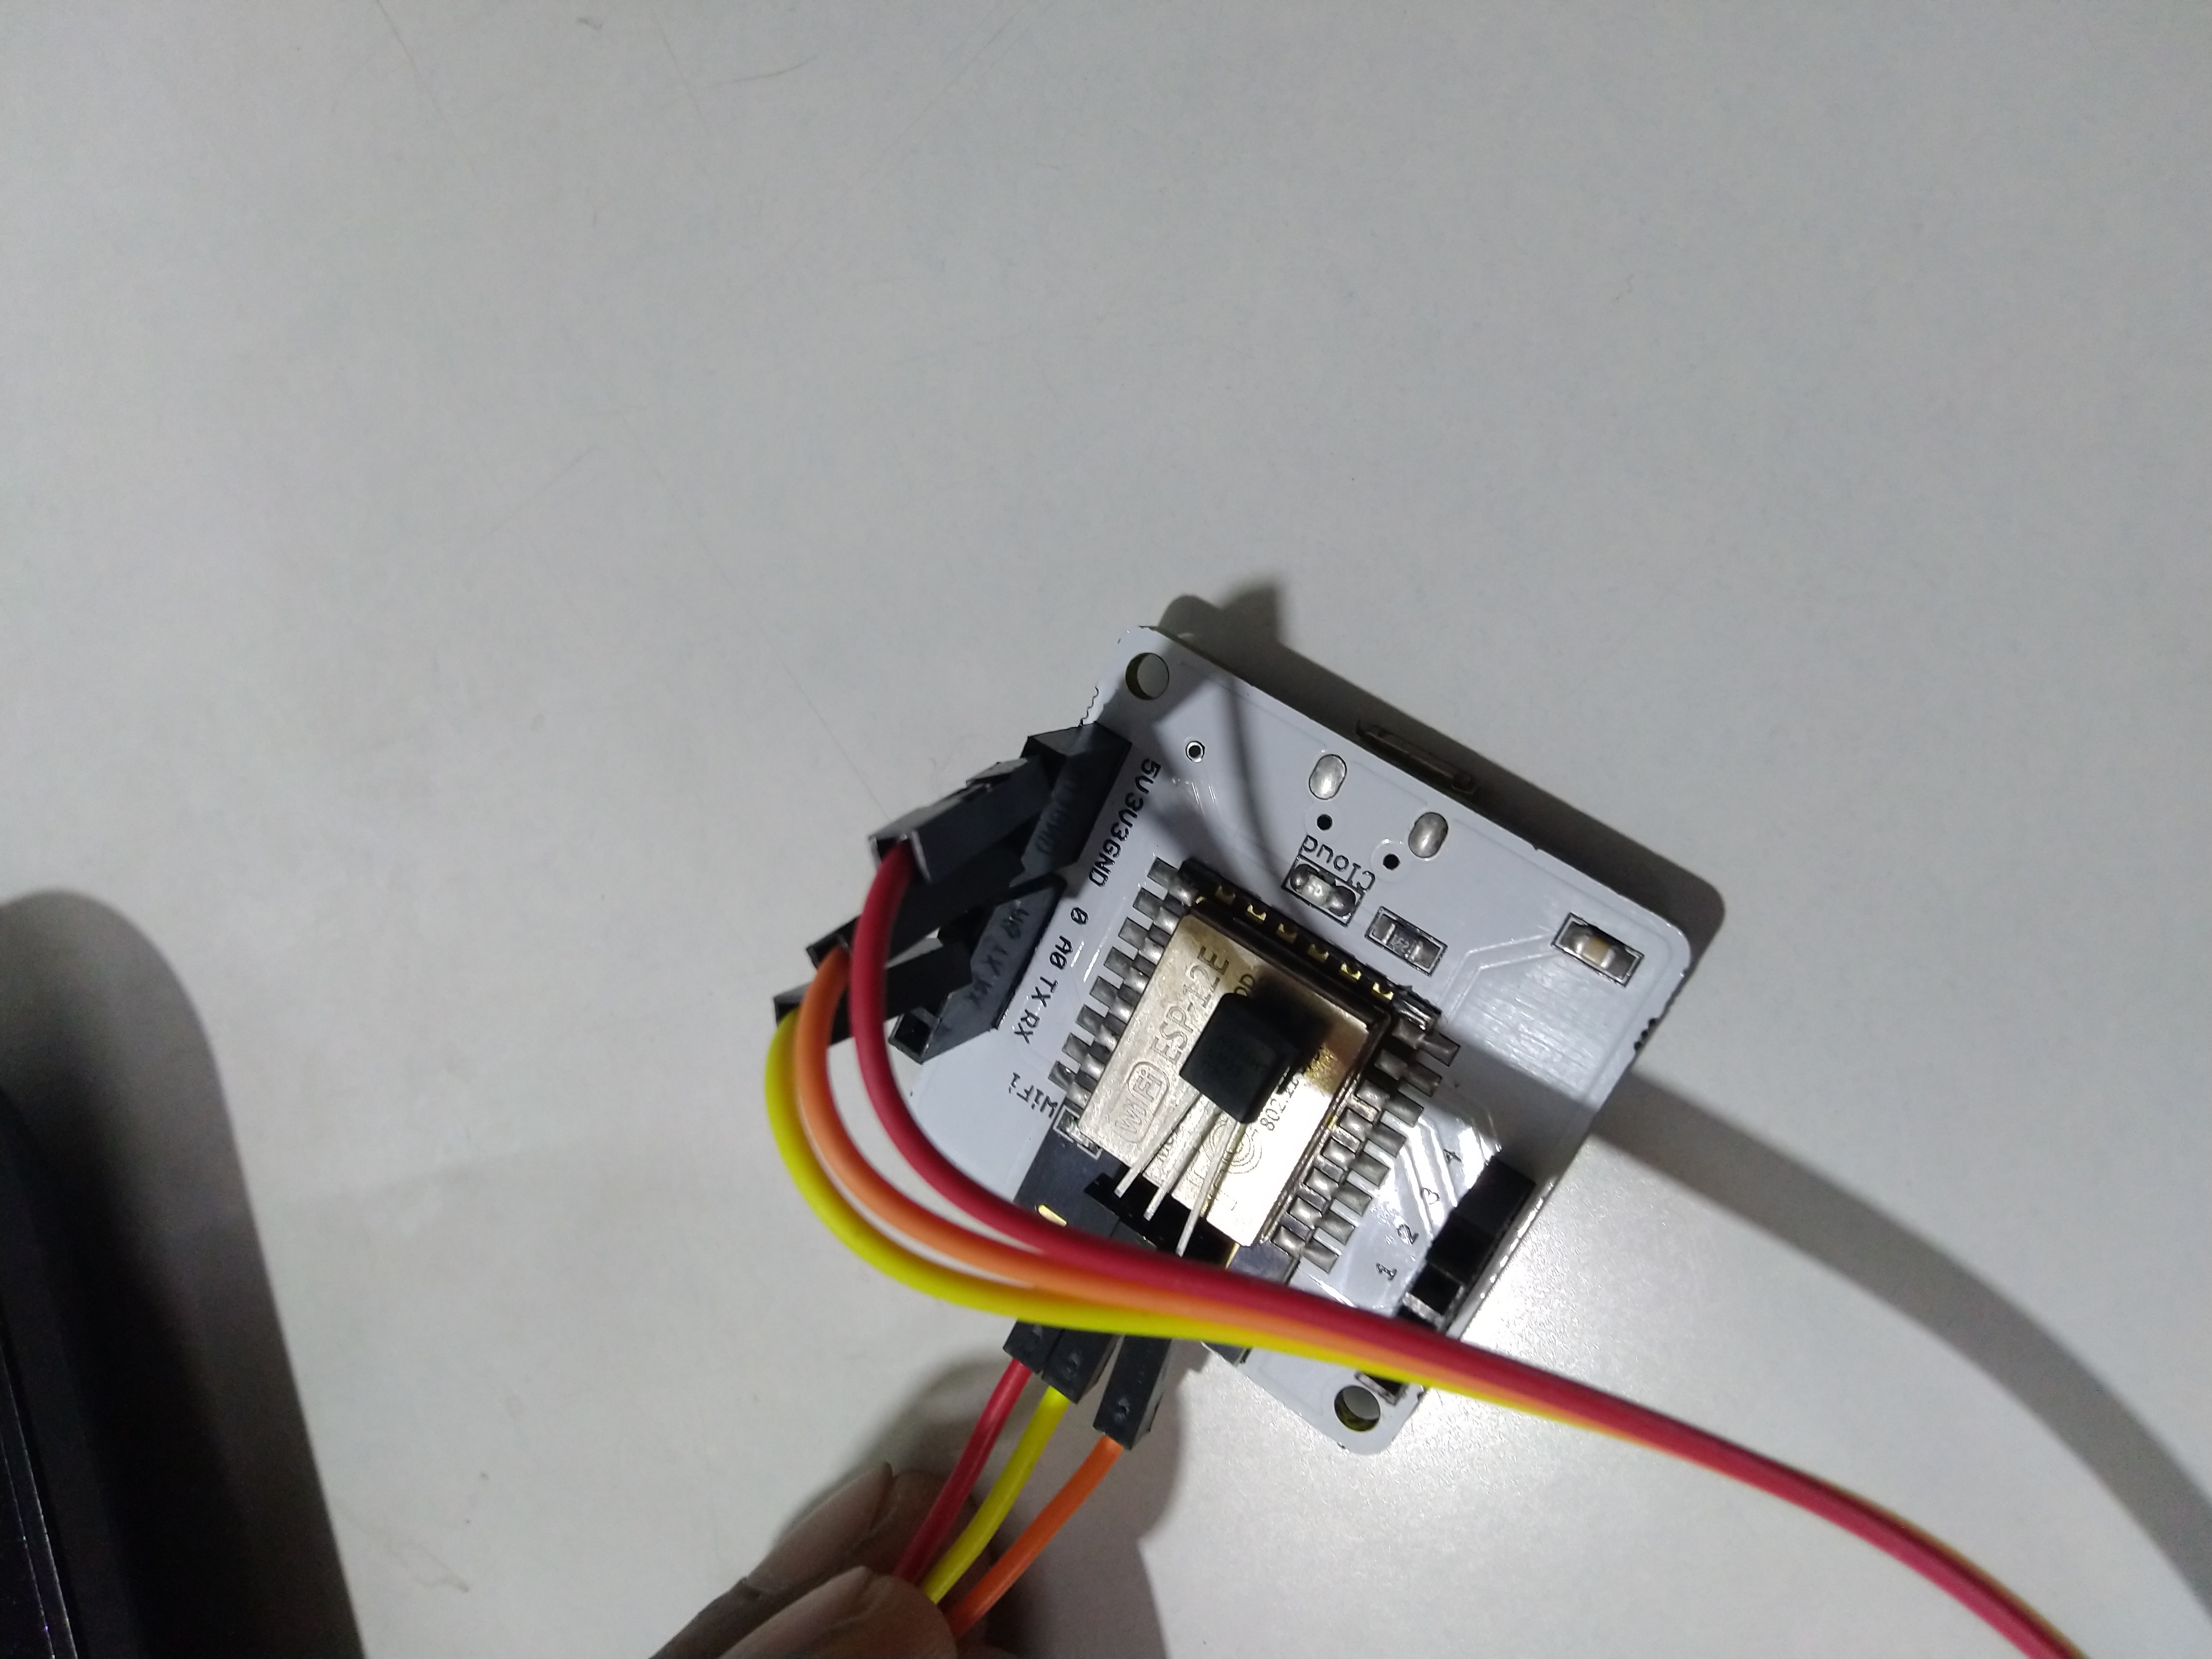
Do the connections as directed below.
Using male to female wire connect the 3 pins of the LM35 to the Bolt Wifi Module as follows:
- VCC pin of the LM35 connects to 5v of the Bolt Wifi module.
- Output pin of the LM35 connects to A0 (Analog input pin) of the Bolt Wifi module.
- Gnd pin of the LM35 connects to the Gnd.
Step 2:
Now you need to have an account on Mailgun for sending the e-mails and also on digital cloud to use cloud computing. Also you need to install PuTTY to code for the digital ocean droplet.
Links are provided below:
Step 3:
Code for prediction of temperature for next 20 minutes. Here we use google prediction graph. Coding is done in JavaScript.
setChartLibrary('google-chart');
setChartTitle('Temperature Prediction For Pharmaceuticals');
setChartType('predictionGraph');
setAxisName('Time','Temperature');
setCrosshair('True');
mul(0.097);
plotChart('time_stamp','temp_in');
Step 4:
Now its time to write a couple of Python codes for the magic to happen.
- Open PuTTY and login using the username as root and the password.
- Now make a Python file named ad_conf.py.
"""api key and device id are stored here"""
API_KEY = 'Bolt Cloud account API key'
DEVICE_ID = 'ID of the Bolt module'
FRAME_SIZE = 10
MUL_FACTOR = 6
NOTE: api key and device id of the device are available on the bolt cloud website.
- Make another file and name it email_config.py.
"""api keys and emails for sending the alert email"""
MAILGUN_API_KEY = 'private API key for Mailgun'
SANDBOX_URL= 'sandbox url for mailgun'
SENDER_EMAIL = 'postmaster@sandbox_url'
RECIPIENT_EMAIL = 'receiver email id'
API_KEY = 'Bolt Cloud accout API key'
DEVICE_ID = 'Bolt device id'
NOTE: all the keys and url are available on the mailgun website.
- Now make another Python file and name it temp_email_anomaly.py.
"""Code for Capestone project"""
import email_config, json, time, ad_conf, math, statistics, datatime
from boltiot import Email, Bolt
min_limit=0
max_limit=41
"""function to compute thresholds"""
def compute_bounds(history_data, frame_size, factor):
	if len(history_data)<frame_size:
		return None
	if len(history_data)>frame_size:
		del history_data[0:len(history_data)-frame_size]
   	Mn=statistics.mean(history_data)
   	Variance=0
   	for data in history_data:
       		Variance+= math.pow((data-Mn),2)
   	Zn= factor* math.sqrt(Variance/frame_size)
   	High_bound=history_data[frame_size-1]+Zn
   	Low_bound= history_data[frame_size-1]-Zn
   	return [High_bound, Low_bound]
mybolt= Bolt(ad_conf.API_KEY, ad_conf.DEVICE_ID)
mybolt= Bolt(email_config.API_KEY, email_config.DEVICE_ID)
mailer= Email(email_config.MAILGUN_API_KEY, email_config.SANDBOX_URL,email_config.SENDER_EMAIL, email_config.RECIPIENT_EMAIL)
history_data=[]
"""to take sensor values from bolt module"""
while True:
	now=datetime.datetime.now()
	print("  ***************\n\n",now.strftime("%Y-%m-%d %H:%M:%S),"\n")
"""to display the current date and time"""
	response = mybolt.analogRead('A0')
   	data = json.loads(response)
   	print ("sensor value: ",data['value'])
   	try:
       		sensor_value = int(data['value'])
       		print ("Current Temperature: ",((sensor_value*100)/1024),"'C")
		"""to check the temperature is within the set limit and
		to send an email if the temperature is not within the limits"""
		if sensor_value > max_limit or sensor_value < min_limit:
           			response = mailer.send_email("Temperature Alert", "The Current temperature is (in 'C) " +str(sensor_value*100/1024))
           			print("a mail has been sent\n")
   	except Exception as e:
       		print ("Error 1",e)
       		continue
	"""anomaly detection to tell if the door has been opened"""
	bound = compute_bounds(history_data,ad_config.FRAME_SIZE,ad_config.MUL_FACTOR)
   	if not bound:
       		required_data_count=conf.FRAME_SIZE-len(history_data)
       		print("Need ",required_data_count," more data points to calculate Z-score")
       		history_data.append(int(data['value']))
       		time.sleep(10)
       		continue
   	try:
       		if sensor_value > bound[0] :
           			print ("SOMEONE HAS OPENED THE FRIDGE DOOR")
       		elif sensor_value < bound[1]:
           			print ("SOMEONE HAS OPENED THE FRIDGE DOOR")
       		history_data.append(sensor_value)
   	except Exception as e:
       		print ("Error 2",e)
   	time.sleep(10)
Run the the code using command sudo python3 temp_email_anomaly.py.
We have got the massage that the door has been opened and an email has been sent alerting about the rise in the temperature.
- Viola!
We are now done with our project. It is a reliable and industry grade system which is good to work in actual scenario.


Comments