

Hardware components | ||||||
 |
| × | 1 | |||
 |
| × | 1 | |||
 |
| × | 1 | |||
 |
| × | 1 | |||
 |
| × | 1 | |||
 |
| × | 1 | |||
 |
| × | 1 | |||
Software apps and online services | ||||||
| ||||||
 |
| |||||
 |
| |||||
 |
| |||||
 |
| |||||
 | ||||||
Present time Technologies are much important in each and every person's life. There lots of digital technologies in the technical market. I choose Internet Of Things and Machine Learning powered by Bolt IoT for this project. This project Freezer Monitor & Anomaly System can be helpful where IoT is used to take the temperature reading from the temperature sensor as input and Machine Learning is used to find the anomaly of the temperature using the Z-Score analysis. Anomaly means differ from normal state. In this system when a anomaly in the temperature is detected, LED is start glowing and Buzzer start buzzing for 2 seconds and turn off and immediately an alert will be sent to the mobile as SMS and Twitter Tweet as well.
Applications:This system is used in the industrial big freezers where temperature has to be maintained within boundaries.
Video Demonstration showing how abnormally detects in temperature:Steps for building System:1. Setup Bolt Cloud- Open www.cloud.boltiot.com on your web browser and SignUp with your credentials.
2. Install BoltIOT app on your mobile and login with your credentials.
3. you can see the active of your device in mobile view as well as desktop view in below figures.
4. Hardware Connections:
Bolt IoT Wi Fi Module
LM35 Temperature Sensor
Buzzer
Male to Female jumper wires
USB cable
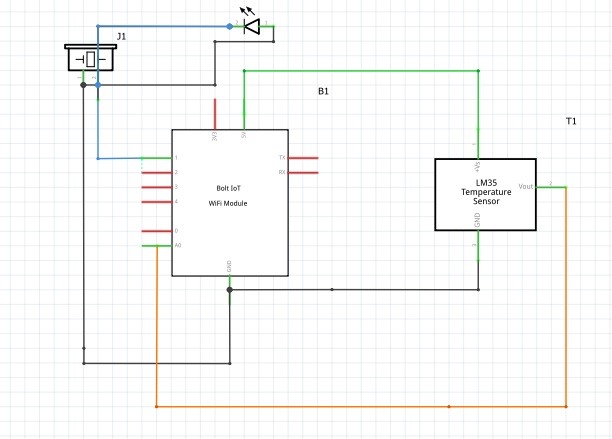
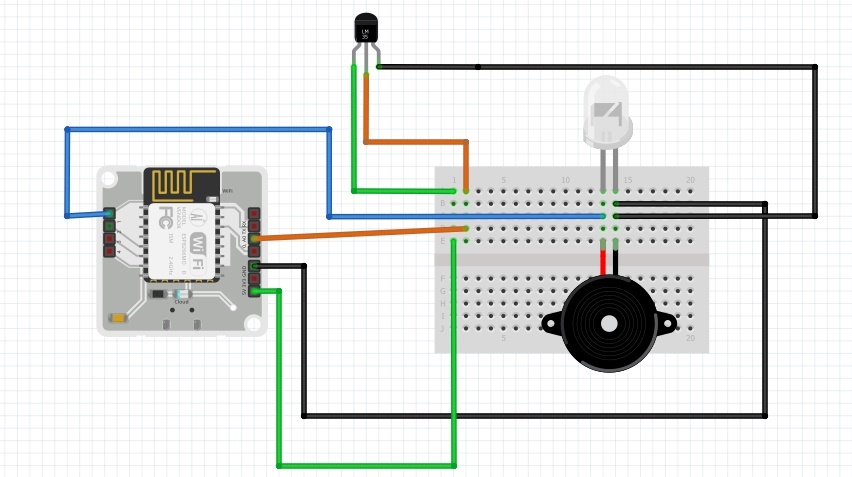
5.CONNECTIONS:
- Connect Bolt IoT WiFi Module to some power supply using the USB cable
- connect LM35 temperture sensor to the Bolt WiFi Module
- VCC pin of the LM-35 Sensor is connected to 5 V. of the Bolt WiFi Module.
- Output pin of the LM-35 is connected to A0 (Analog input pin) of the Bolt WiFi Module
- GND pin of the LM-35 is connected to the GND
- Connect Buzzer and LED to the Module
Negative PINs of both elements connects to the GND and Positive PINs connects to GPIO Digital PIN '1'
5. Software & Online Services:
A. TWILIO:
B. Amazon AWS Instance:
C. Generating API in Bolt cloud
D. Tweepy: Twitter for Python!
The easiest way to install the latest version from PyPI is by using pip:
pip install tweepyYou can also use Git to clone the repository from GitHub to install the latest development version:
git clone https://github.com/tweepy/tweepy.git
cd tweepy
pip install .
a. Visit twitter Developer:
Go to Apps showing in screen shot and create new. I have already created:
b. Generate your Credentials from here:
c. Code For Tweet:
import tweepy
import json, time
# Dictionary to store credentials as key-value pairs.
config = {
"consumer_key"    : 'XJZqtitsXXXXXXXXXXXcri96sn',
"consumer_secret"     : 'PzVz9mYwXXXXXXXXXXXXXXq6gv9cohpn5JYTdppTjxk',
"access_token"        : '160394868XXXXXXXXXXXXsjW7Q5UJe7GJxniJW',
"access_token_secret" :'F3lhrkXXXXXXXXXXXXXXXXXXXXXXXXXXXXXXXXXXXXXX'
# Method to authenticate user via Tweepy and return API object
def get_api_object(cfg):
auth =tweepy.OAuthHandler(cfg['consumer_key'],
cfg['consumer_secret'])
auth.set_access_token(cfg['access_token'],
cfg['access_token_secret'])
return tweepy.API(auth)
print("Tweeted")
api_object = get_api_object(config)
# Store the tweet message in the variable
tweet = ("tweet tested")
# Post the tweet on your Twitter account using the update_status method.
status = api_object.update_status(status=tweet)
except Exception as e:
print ("An error occurred ", e)Step-1: Fetch the latest sensor value from the Bolt device.
Step-2: Store the sensor value in a list, that will be used for computing Z-Score.
Step-3: Compute the Z-Score and upper and lower threshold bounds for normal and anomalous readings.
Step-4: Check if the sensor reading is within the range for normal readings.
Step-5:If it is not in range, send the SMS and tweet as well
Step-6: Wait for 10 seconds.
Step-7: Repeat from step 1.
7. Z-SCORE ANALYSIS:Z-score analysis is used for anomaly detection. Anomaly here means a variable's value (light intensity of the surroundings) going beyond a certain range of values. The range of values is called bounds (upper bound and lower bound). These bounds are calculated using the input values, frame size and multiplication factor. The frame size is the minimum number of input values needed for Z-score analysis and the multiplication factor determines the closeness of the bounds to the input values curve.
.1. create a file named freezer_monitor.py in python programming language
sudo nano freezer_monitor.py2. import the moudles json, time, math, statistics, conf, Bolt, Sms
import json,time,math,statistics,conf
from boltiot import Bolt,Sms- json module is used in this project to parse the data from API
- time module is used in this project to sleep the process for 10 seconds and continue again
- math module is used in this project to calculate power and square root
- statistics module is used in this project to calculate mean of the data
- conf.py file is imported to access the bolt device credentials and credentials for twitter.
- sms module is used to access sms helper library
- boltiot is used to access bolt iot wifi module and accessing library made for python
3. def compute_bound a function which calculates the Z-score and the using the Z-score calculates the boundaries required for anomaly detection.
def compute_bounds(history_data,frame_size,factor):4. above function takes 3 input variables: hisotry_data, frame_size and factor.
if len(history_data)<frame_size :
    return None
if len(history_data)>frame_size :
    del history_data[0:len(history_data)-frame_size]
5. The above code checks whether enough data has been accumulated to calculate the Z-score, and if there is too much data, then the code deletes the older data.
Mn=statistics.mean(history_data)6. The above code calculates the mean (Mn) value of the collected data points.
Variance=0
for data in history_data :
    Variance += math.pow((data-Mn),2)
7. This code helps to calculate the Variance of the data points
Zn = factor * math.sqrt(Variance / frame_size)
High_bound = history_data[frame_size-1]+Zn
Low_bound = history_data[frame_size-1]-Zn
return [High_bound,Low_bound]
8. Here we calculate the Z score (Zn) for the data and use it to calculate the upper and lower threshold bounds required to check if a new data point is normal or anomalous.The next code is used to initialize the Bolt, SMS variable, which we will use to collect data and send SMS.. Here we also initialize an empty list with the name 'history_data' which we will use to store older data, so that we can calculate the Z-score.
mybolt = Bolt(conf.API_KEY, conf.DEVICE_ID)
sms = Sms(conf.SSID, conf.AUTH_TOKEN, conf.TO_NUMBER, conf.FROM_NUMBER)
client=Client(conf.SSID,conf.AUTH_TOKEN)
history_data=[]
9. The following while loop contains the code required to run the algorithm of anomaly detection.
while True:
    response = mybolt.analogRead('A0')
    data = json.loads(response)
    if data['success'] != 1:
        print("There was an error while retriving the data.")
        print("This is the error:"+data['value'])
        time.sleep(10)
        continue
    sensor_value= int(data['value'])
    sensor_valuec = sensor_value/10.24
    print ("Current Freezer Temperature is •C "+str(sensor_valuec)
    sensor_value=0
    try:
        sensor_value = int(data['value'])
    except e:
        print("There was an error while parsing the response: ",e)
        continue
    bound = compute_bounds(history_data,conf.FRAME_SIZE,conf.MUL_FACTOR)
    if not bound:
        required_data_count=conf.FRAME_SIZE-len(history_data)
        print("Not enough data to compute Z-score. Need ",required_data_count,/                   " more data points")
        history_data.append(int(data['value']))
        time.sleep(10)
        continue
9. Create Product on Bolt Cloud:
setChartLibrary('google-chart');
setChartTitle('Polynomial Regression');
setChartType('predictionGraph');
setAxisName('time_stamp','temp');
mul(0.0977);
plotChart('time_stamp','temp');


Comments