

Hardware components | ||||||
 |
| × | 1 | |||
|
| × | 1 | |||
 |
| × | 1 | |||
Software apps and online services | ||||||
| ||||||
| ||||||
A person's vehicle lasts long and runs well when maintained right. One can maintain it well by giving it for timely service. Often times than not it becomes hard to know when exactly is the right time for it. This leads to either early, unnecessary service hitting our pockets or delaying it to a point where it becomes an impediment to daily life.
One way to get over this problem is making monitoring of vehicle health easy and intelligent!
By placing a smart device that is capable of gathering necessary data points about various parameters in/about the vehicle and later using the same to get better picture of what the vehicle is being subjected to will help out a vehicle owner a lot when it comes to deciding a good time for service.
It was evident what was needed - an IoT device with a very small footprint that is jam packed with sensors. And NXP's Rapid IoT kit fit the bill perfectly.
Rapid IoT!It worked seamlessly out of box and within minutes of playing with the hardware and the online studio - I was able to get a sensor value onto to the cloud without any hiccups!
I added necessary sensor data to be read to monitor vehicular motion and other parameters -
- accelerometer readings
- gyroscope readings
- temperature
- Humidity
- CO2
- TVOC.
And making changes on application and cloud side I was able to get the readings on the Rapid IoT App and the cloud that helped visualization..
Although everything worked well I felt the dependence on phone was not the right way to do it.
Enter Raspberry Pi Zero W!I was at a loss of ways to proceed further but the hackster community helped me out. Reading through the other interesting ideas and submitted projects I came across Ben's Pantry Monitoring IoT Device. This helped to make my project independent of any phone and making it a stand alone device by making use of Raspberry pi zero W, grafana and influxdb.
The SetupGrafana and Influxdb runs on the desktop-pc that is connected to the home network.
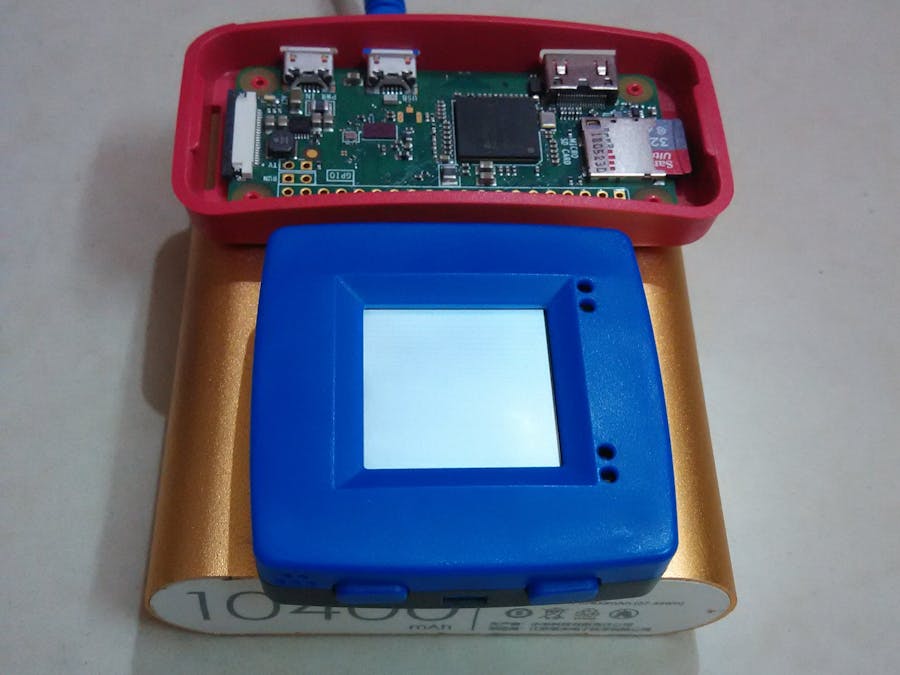
Rapid IoT Kit and Raspberry Pi Zero W along with a power bank (connected to car charger if need be) is placed in the vehicle.
The IoT kit continuously transmits data to Rpi every 100ms. RPi, if connected to home WiFi network will transmit data else stores it until it gets to connect to it at a later time.
Code that runs on RPi on power up.
import time
import os
import pygatt
import binascii
import struct
import json
from subprocess import check_output
from influxdb import InfluxDBClient
RPK_ADDRESS = "00:00:00:00:00:00" # Change this with your Device's BT Address
CHAR_UUIDS = {
  "accelX":"13eb9b68-b891-4134-b09e-e61554e9929e",
  "accelY":"d9a450ad-1421-486d-a72d-865572419ae6",
  "accelZ":"f837afa7-24bc-406b-86e7-c7a90c3704d4",
  "rotX":"7ffd87ab-d953-4342-a2f0-96f229ffddd5",
  "rotY":"846f131b-5cbd-42ee-85ad-f2d31dc97217",
  "rotZ":"8f1cee1b-86fe-4c25-a261-d0bb3a4f2368",
  "Temp":"a213c47d-a4ad-4e8f-8d97-dc479688363e",
  "Humidity":"4bece079-eb30-40ac-8361-5558eeb6b22f"
}
CHAR_UUIDS_2 = {
  "tvoc":"feb23eee-fa4f-4e87-aaaf-85a2dac44f29",
  "co2":"e5eb79f4-0bc4-4207-9f2d-b1e00ed95ab4"
  }
def save_prk_values():
  """ Saves BLE sensor values, got using BLE-GATT, to an InfluxDB database """
  adapter = pygatt.GATTToolBackend()
  db_client = InfluxDBClient('000.000.0.00', database="rpk")#IP of the desktop-pc
  try:
      # Connect to the RPK device
      adapter.start()
      conn = adapter.connect(RPK_ADDRESS)
      while(1):
         print("start")
         time_info = int(time.time()*1000000000.0)
         # Get sensor values
         sensor_values = {}
         for sensor in CHAR_UUIDS:
             value = conn.char_read(CHAR_UUIDS[sensor])
             print(sensor)
             [value] = struct.unpack('<f',value)
             print(value)
             sensor_values[sensor] = value
         # Save to DB
         for sensor in CHAR_UUIDS_2:
             value = conn.char_read(CHAR_UUIDS_2[sensor])
             print(sensor)
             value = int.from_bytes(value,byteorder='little')
             print(value)
             sensor_values[sensor] = value
         measurements = []
         for sensor in sensor_values:
             measurement = {"measurement" : sensor, "time" : time_info, "fields" : {"value" : sensor_values[sensor]}}
             measurements.append(measurement)
         wifi_ip = check_output(['hostname', '-I'])
         if wifi_ip.decode() == '000.000.0.00 \n': #IP of rpi
            try:
               with open('foo.txt') as f:
                 lines = f.readlines()
                 lines= [x.strip() for x in lines]
                 for line in lines:
                    print(line)
                    contents = json.loads(line)
                    db_client.write_points(contents)
               os.remove("foo.txt")
            except Exception as e:
               print ("Error: ", e)
            db_client.write_points(measurements)
         else:
            fo = open("foo.txt", "a")
            json.dump(measurements, fo)
            fo.write('\n')
            fo.close()
         time.sleep(0.1)
         print("end")
  except Exception as e:
      print ("Error: ", e)
      msg = "BLE: [%d] %s"%(time_info, e)
  finally:
      adapter.stop()
if __name__ == '__main__':
  save_prk_values()
Once transmitted with time stamp the data points can be visualized using grafana dashboard.
The setup has been working as expected. The various panels seen in the above dashboard give insights about what the vehicle is undergoing throughout the uptime of the setup.


Comments