


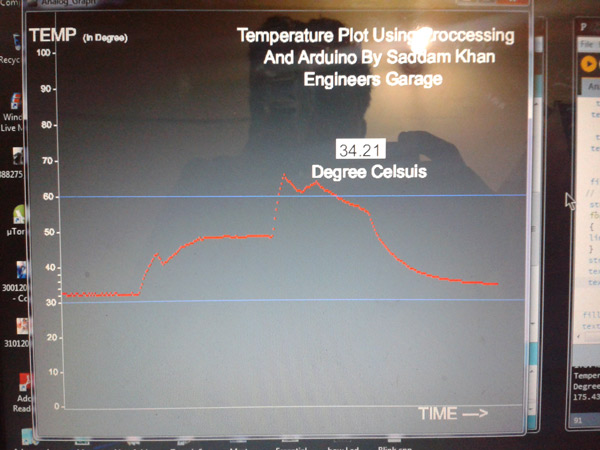
The plotting of data on a graph is used to observe and subsequently describe the visible patterns that exist within the data. The main aim of this project is to show, how to plot a variable graph using processing environment and Arduino. In this article temperature is plotted on the processing graph. Processing environment is quite similar to Arduino but the difference is that in the former we can plot the graph whereas in the latter we can’t plot any type of graph. Processing Environment is very useful in cases of plotting Analog graphs.
Here we are going to discuss plotting temperature graph on computer or laptop using Processing Environment and Arduino. Circuit of reading temperature is very simple. In this system only one circuit LM35 temperature Detector / Reader is used and directly connected with Analog pin number A0 of Arduino. And a 16x2 LCD is connected with this circuit for displaying temperature. See the block diagram given below to understand the working of this project.
From Arduino, we just read Analog output of temperature sensor and after some calculations Arduino sends data for Processing by using FTDI basic breakout. But you can use any of TTL logic converters to communicate with Desktop or Laptop with Arduino. But in Arduino UNO, there is no need of any other external converter because Arduino UNO Board is already configured with logic converter. But if you have Arduino UNO at home or lab then you should have a TTL Logic Converter.
Displaying the GraphThe formula for calculation of temperature given below:
Temperature= Analog reading * (5.0/1023.0) * 100;
Processing: Processing is an Environment like Arduino. In Arduino we uses
Temperature= Analog reading * (5.0/1023.0) * 100;
Processing: Processing is an Environment like Arduino. In Arduino we use
Void setup()
{
}
Void loop()
{
}
But in processing we use
Void setup()
{
}
And
Void draw()
{
// main program;
}
Line (x1, y1, x2, y2)
This function is used for plotting line on graph. The trace in graph is also plotted by using this function.
Where:
X1 is starting point in x direction on graph.
Y1 is starting point in y direction on graph.
X1 is ending point in x direction on graph.
Y1 is ending point in y direction
Font and Text
By using text function we can plot text on graph window.
Text(“text”, x, y);
Where:
Text= text as you want to plot.
X = position of text in x direction.
Y = position of text in y direction.
Port
myPort = new Serial(this, Serial.list()[0], 9600);
selecting port
where:
serial.list()[0] Port
9600 is baud rate
Circuit
Please refer to the circuit diagram tab for circuit of this project
Components Used
1. Arduino
2. Processing software (Environment)
3. LM35
4. Power supply
5. Connecting wires
6. FTDI breakout
7. 16x2 LCD
8. POT
9. Computer/Laptop
10.Solder Iron

Comments