

Hardware components | ||||||
| × | 1 | ||||
_copy_P5AWOdT4dX.png?auto=compress%2Cformat&w=48&h=48&fit=fill&bg=ffffff) |
| × | 1 | |||
A major problem for seniors in developed countries is being able to live independently, without constant care or supervision. Many seniors are still mostly functional, however they may have medical conditions that may occur without warning, leaving them seeking immediate medial attention. This necessitates constant supervision from healthcare staff, in order to ensure that these seniors are still healthy.
As a researcher at the Research Institute for Aging in Waterloo, Canada, I am working on a wireless, non-invasive method to detect the breathing rate of humans. This is especially useful for seniors, as they may not be able to use wearable technology to monitor their health. This allows them to live their normal lives, without constant supervision from staff.
Breathing DetectionWhile breathing detection is included in the Walabot API, whether this breathing is accurate or not has not been measured. By comparing a custom Walabot breathing detection function against a gold standard, the viability of a Walabot breathing detection system can be demonstrated.
Gold Standard ComparisonFor the gold standard that the Walabot will be compared to, I am using the Bioradio system with a respiratory measurement belt. This allows for accurate breathing measurements by putting a belt on someone’s chest. The software included with the Bioradio allows for the data to be written to a file, as well as to be displayed on a live graph.
The included code writes the Walabots data to file, while also displaying it on a live graph as the test is running.
By running the Bioradio at the same time as the Walabot, the results of the two can be compared in real time, as demonstrated in the video. I have also attached a graph of a longer amount of time, showing the difference between the values of the Walabot and the Bioradio.
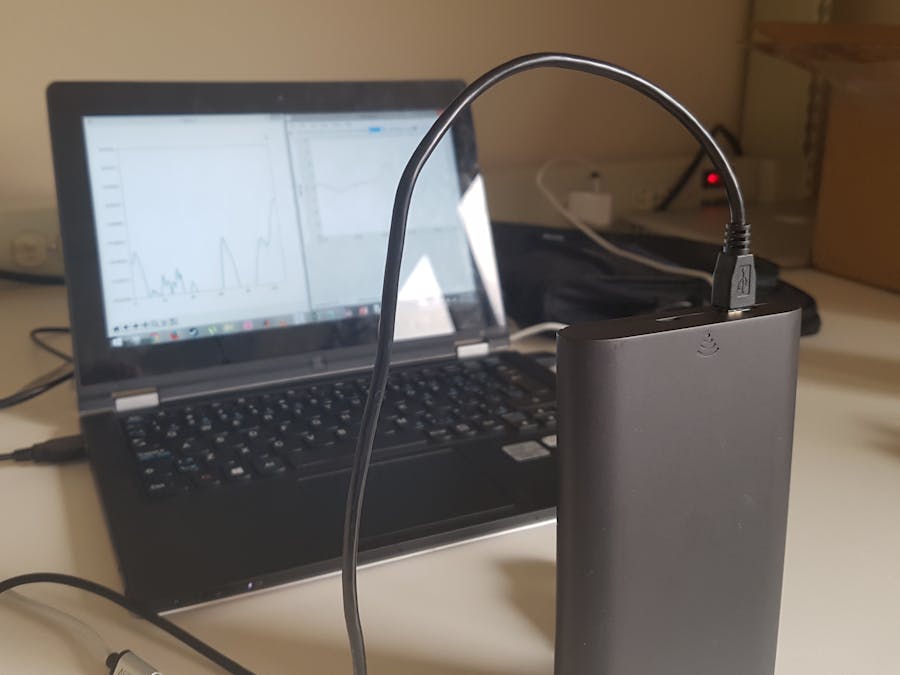
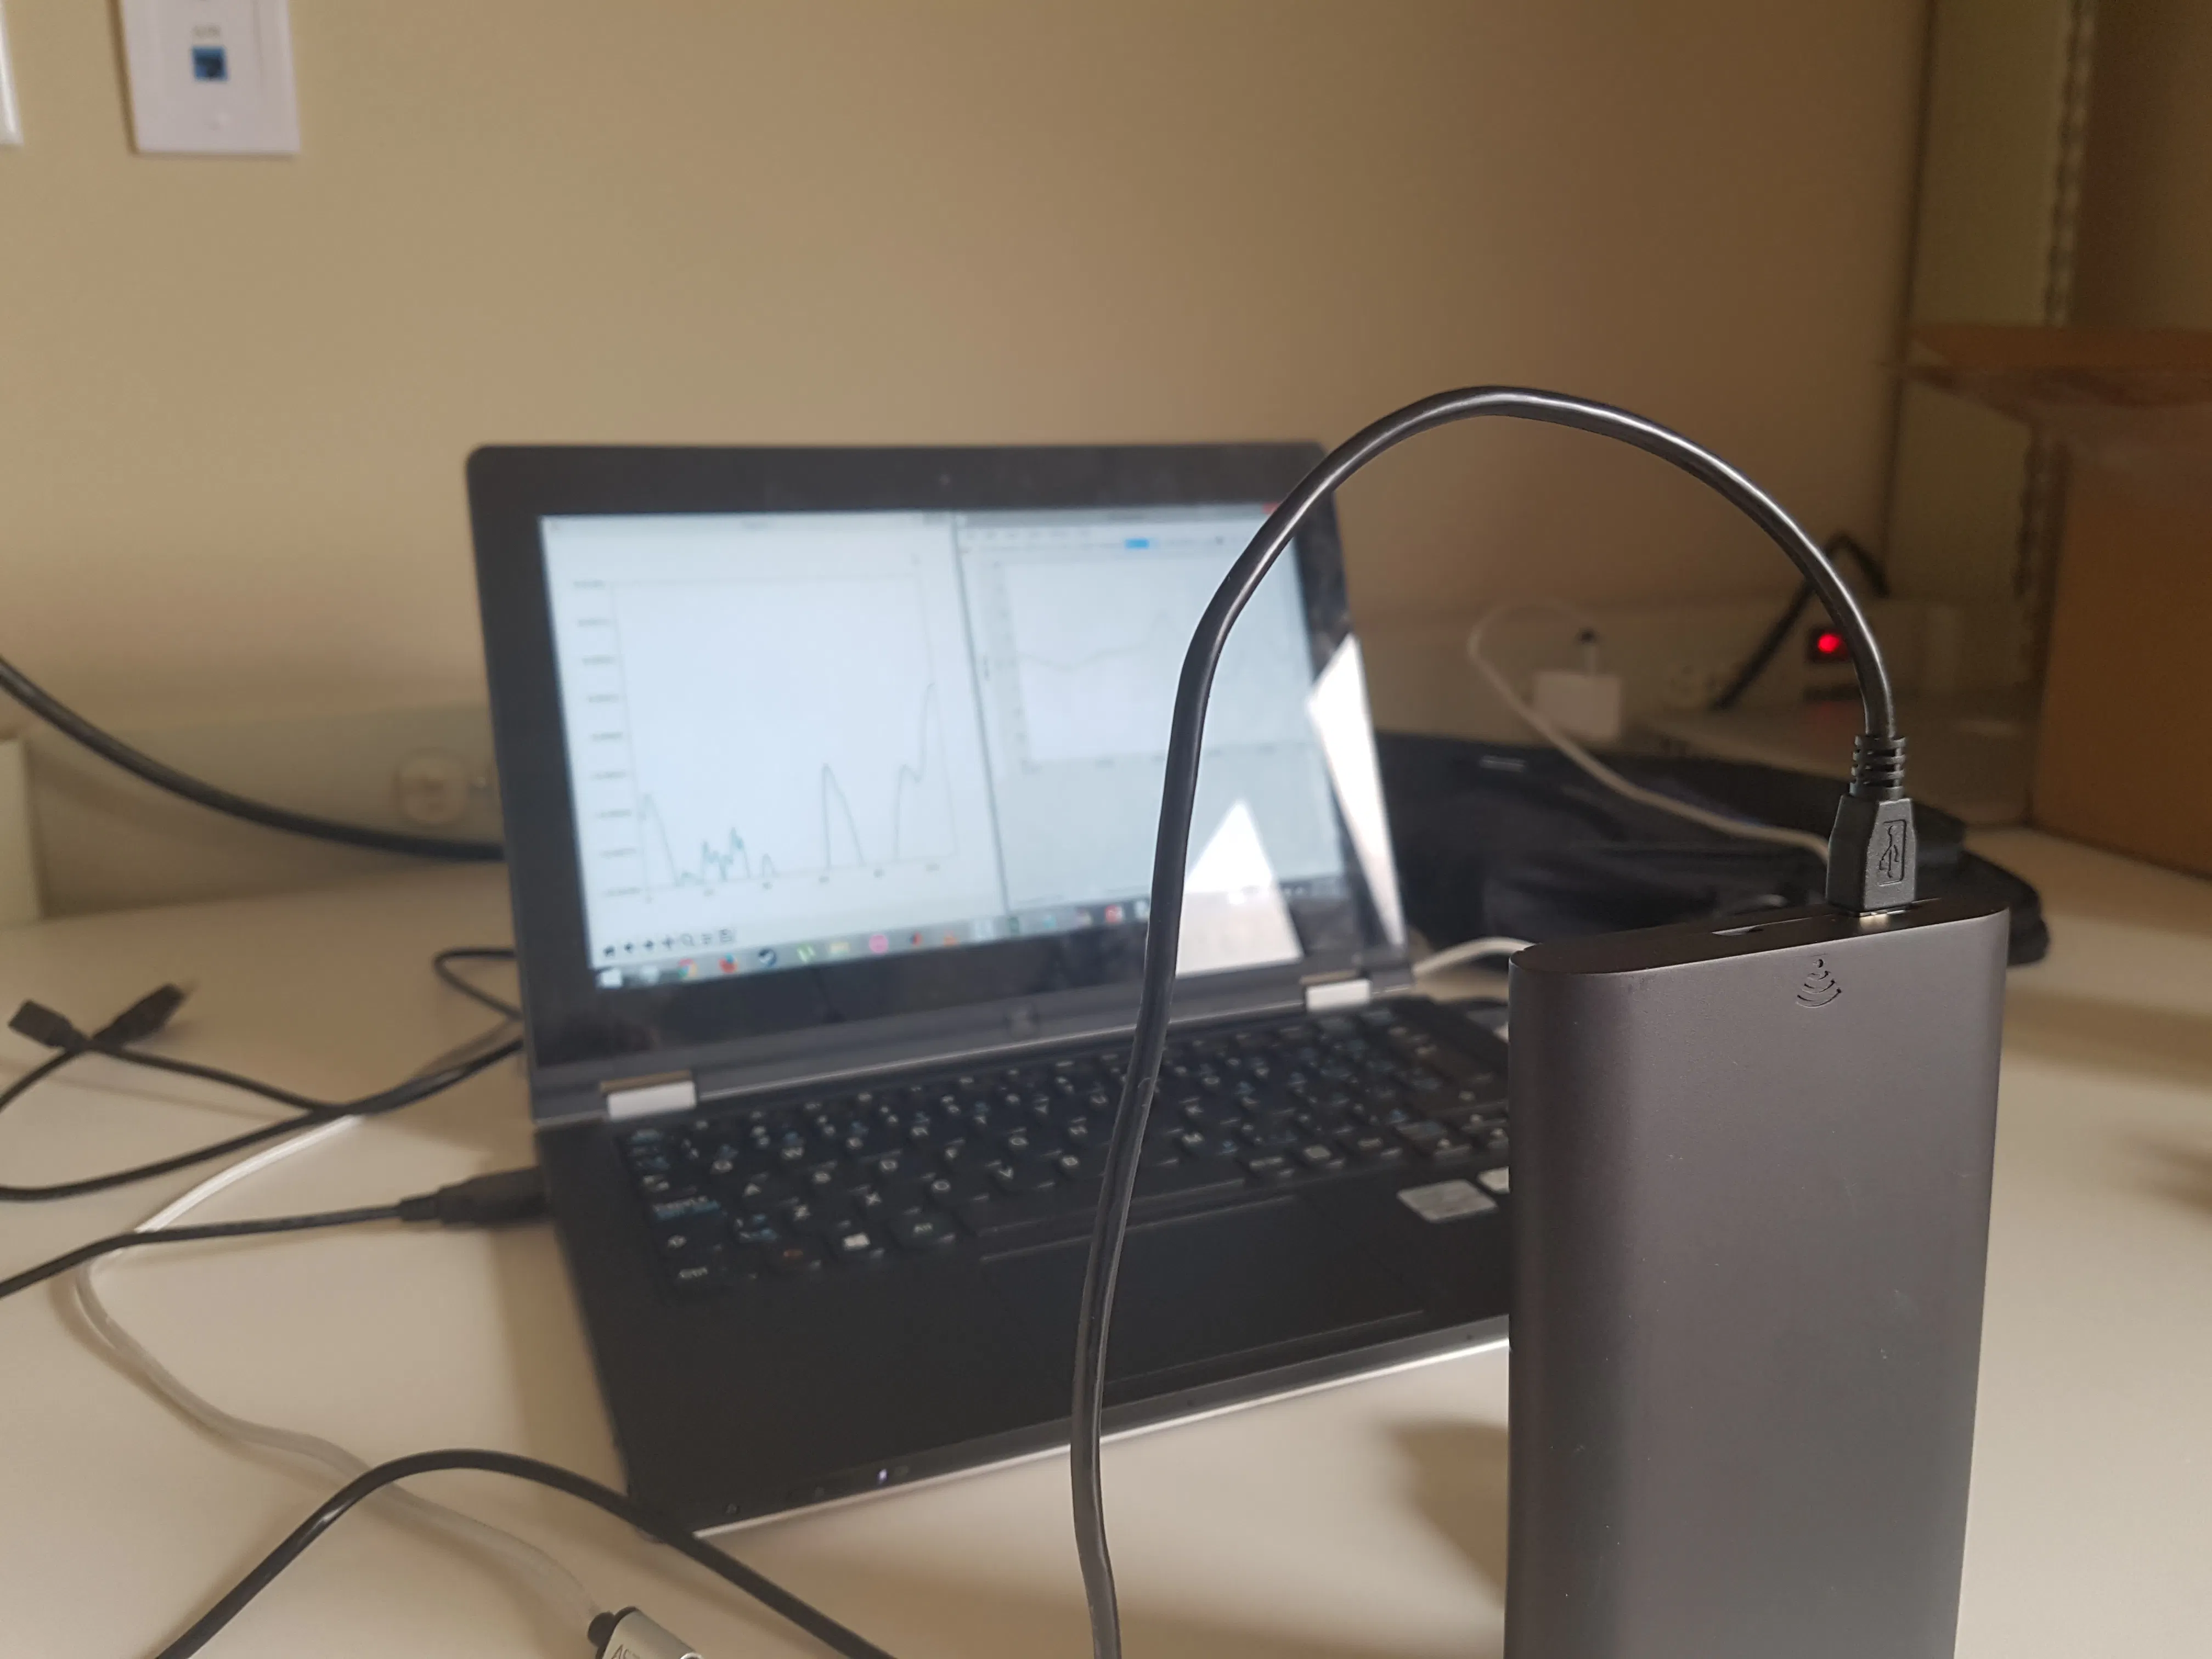
Demonstration VideoDemonstration Photos
Walabot vs Bioradio Graph


Comments