
Hardware components | ||||||
| × | 1 | ||||
 |
| × | 1 | |||
Software apps and online services | ||||||
| ||||||
 |
| |||||
| ||||||
| ||||||
Prerequisites: you have an UPS device that's managed by Network Ups Tools (NUT) and a monitoring platform to receive the data, e.g., a database and a dashboard front end like Grafana. If you need help setting up NUT, Techno Tim on YouTube has a great tutorial that you can find here.
Back Story: the genesis of this project is the dilemma a lot of home labbers run into after deploying a UPS and a tool like Network Ups Tools (NUT) to manage it: how do I export the data from my UPS for view with a tool like Grafana? I was looking into using a code library or an API layer to retrieve the data, when it occurred to me that the simplest solution would be to run the bash command for querying the UPS via the NUT client within a Python script (upsc upsname@nut-server-ip-address) and then convert the output to a dictionary. The result was 6-7 lineso of code that retrieves the data from the UPS and then converts it to Python dictionary, from there it's trivial to export the data as a JSON that you can write to InfluxDB, transmit via MQTT, etc.
Setup: you’ll need to have the following in place before you can start running test queries in Python against your UPS devices:
- A UPS device managed by a computer running NUT server, in my case I installed NUT server on a Raspberry Pi 4B and connected it to the UPS via USB
- Nut client installed on the machine that you’ll run the sample Python script on. You don’t need a separate machine for this, you can just run the script on the same device that is being used to manage the UPS devices. For the record: I ran my test queries from a separate device I do all my development work on, and then deployed the solution in a Docker container on a Kubernetes cluster.
Once the above items are ready to go, the following code snippet will query your UPS, return a Python dictionary with the data, and print it out in an easy to read format:
import os
from pprint import pp
import subprocess as sp

# IP of your server running NUT, you can hard code for initial testing
UPS_IP = os.environ['UPS_IP']
# name you gave your UPS during setup, you can hard code for testing
UPS_ID = os.environ['UPS_ID']


# define the command, same one you'd use at the command line
CMD = "upsc " + UPS_ID + "@" + UPS_IP

# run command using subprocess library, clean up output
data = sp.check_output(CMD, shell=True)
data = data.decode("utf-8").strip().split("\n")

# parse data into a list of lists, each pair of values will be in its own list
initial_list = [i.split(':') for i in data]

# convert the list into python dictionary, each list in the list of lists
# becomes a key value pair
test_dict = dict(initial_list)

# print out the dictionary to see the values
pp(test_dict)
You can find the above code in my repo here (note: part of a much larger project). Once the snippet is running, you will just need to modify it to be able to transmit//write data to whatever you use for data logging, monitoring, visualization, et, al.
For production/deployment I expanded from the above snippet quite a bit:
- Converted the data to JSON
- Added ability to transmit the data via MQTT
- Added a threshold check that will send me a Slack alert if the UPS load goes above a predefined threshold, which is currently set at about 3x the typical load.
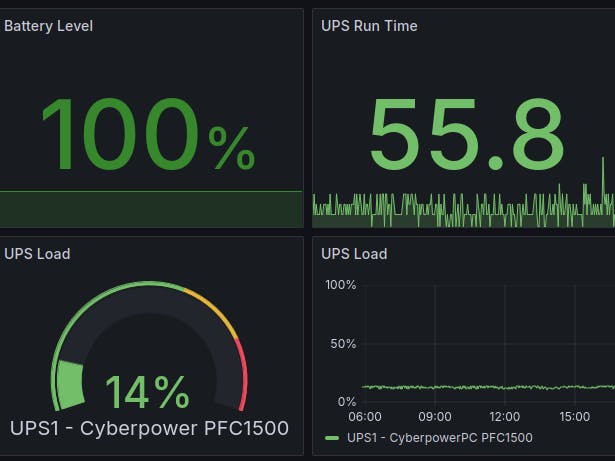
Node-RED picks up the data from the MQTT topic and then writes it to InfluxDB, where it can be displayed in Grafana. The code runs in a Docker container that is deployed on my Kubernetes (K3s distribution) cluster.
You can find the production version here.
That's pretty much it: a small amount of Python code you can use to query any NUT managed UPS and receive the data in a easy to use format without having to use any additional libraries. An added benefit is that you can use this approach for practically anything that involves running a query from the command line, e.g., running SMI queries on an NVIDIA GPU, I have an example of that here.


Comments