

Hardware components | ||||||
 |
| × | 1 | |||
 |
| × | 1 | |||
| × | 1 | ||||
Software apps and online services | ||||||
 |
| |||||
 |
| |||||
This project it's advised to have basic knowledge of Arduino/Energia and MatLab. I will go into detail how to use the sonar or use MatLab functions like "linspace" or "plot", "axes", etc.
Note: I do know no Arduino has a plotting tool, still, you might need something more which requires MatLab. This introductory to the notion you can do this in MatLab, it's not a good idea to start with something harder. Later I will probably show how to plot multiple values, each in 1 windows.
IntroductionSince I have started using MCUs and sensors in high school (with a pickaxe) I like using graphs to analyze the data, sometimes using the serial monitor by printing 1 value per line to easily copy it to excel and create a graph, analyze maximum and minimum value, average, etc. Of course this was not ideal nor real time - the best alternative was just for the max and min being calculated in the microcontroller and printed later.
After a while I started using the TM4C launchpad with Code Composer Studio which allowed to at least see 1 variable in graph in real time and then later I learnt in university about MatLab (and processing on my own, but that's for another project).
Well MatLab is a great tool, and there's actually lots of programs from MathWorks that come with it in a packet(well I have a student package that has a big packet) like SimuLink which is also very good. But let's not talk about all those now, let's just focus on MatLab.
With MatLab you can make different type of graphs, just 1 with 1 or more functions, or multiple graphs in different windows, you can analyze the data, save it in files, etc. It's after all MATLab. And you can actually receive data from the serial port, from a COM and plot the data in real time by creating a script.
Now note, MatLab can be used to make some calculations really fast, like having a microcontroller gather and send sensor data for the computer to calculate, but plotting of graphs is not that fast. For the script that will be shown here, I used a very small computer with a 2016 Celeron core run it and the processor was always at 100% because I was plotting in real time (there was almost no lag though)- if I gathered like 3 values at a time and plot it, there was already a clear improvement (something like the processor at 60%) - points is: plotting is heavy and slow (well a i7 dual core didn't break a sweat).
Microcontroller (MCU) used:- TM4C launchpad with Energia.
Energia allows to program a lanchpad like Arduino so you can use the code, just change the pins to the ones you want.
You can use any MCU with the MatLab program, I just used this since it's easier to explain how everything will work and focus more on the MatLab part.
Hardware- Like stated above, a MCU board (note, I used a 5V tolerant board, if you use a 3.3V MCU remember to protect the pin connected to the Echo pin from the sonar)
- Jumper Wires
- HC-SR04 sonar or a SRF04 (I actually used a SRF04)
- MatLab (used r2016a)
- Energia IDE (or Arduino IDE if you're using an Arduino)
The code for the MCU is really simple. I used the most common example for the SRF04 that there is, the only difference was, I changed the baudrate from 9600 to 115200 and changed what is sent by serial. (click image bellow to enlarge)
In the end of the loop you can see I changed Serial.println() to Serial.write() (some might have not even know that was a thing!) and limited the variable "distance" to never go over the value 255.
For the sake of simplificity, instead of sending the string of a number, like "255" which requires 3 bytes ("2" , "5" and "5") and a number like "12" requires 2 bytes ("1" and "2"), why not send instead just the number? 1 byte can represent a number from 0 to 255 (if considered unsigned), which means you can send any distance from 0 to 255cm with just 1 byte. To simplify let's discard any distance over 255cm to just use 1 byte.
So that's why Serial.write() is used. If you used Serial.println() it would convert the value of "distance" to a string.
In another tutorial I will show how to send numbers bigger than 8bits when using this "no strings" method.
MatLab scriptThe MatLab script will have to do 2 things:
- Read the data from the serial port
- Plot the values in a graph
Read the data from the serial portTo use the serial port we first must initialize and open it. It's pretty easy:
"serial()" will configure the port.
1st parameter is the port name, in windows that's "COMx" being "x" the number of the port you want - check the device manager or Energia IDE to know which port you have the board connected to.
Then we will just configure the baudrate and leave the rest on default. So we say first 'baudrate' to say we want to configure it and then the value, in this case I chose 115200.
With that done we open the port by using "fopen()" with the value returned by "serial" (much like file descriptors in linux).
Now this part is similar with Energia/Arduino Serial library. Let's wait for a value to be available, and only then read. For simplicity let's read as soon as we get 1 byte.
To then read the data we then use "fread()"
1st parameter is the serial port descriptor returned by "serial()" and 2nd parameter is the number of bytes to be read (in this case let's read just 1)
Pretty easy right?
When you are done with using the serial you should close it and delete the config from memory of MatLab or else no other process will be able to use it (not even your script if you run it again)
If you ever used MatLab you must already know how to make a graph out of 2 arrays of data.
First create 2 arrays of the same size:
You can see here I used 2 variables, "points" and "data_period" to set the size of the arrays and the maximum value of "x", respectively. This is relevant to this specific project. "x" goes from a negative value to 0 because it will represent in milliseconds how long ago the value occurred
"y" will be where you put the values received by serial. For now it's all zeros.
Then just call "plot" or "area" and a graph will be made, right? (I used area because it's looks better). "figure" is usually not used for single plots, but I had a weird bug when I wrote this and had to have in the script. I also close all open figures just in case any was left opened by mistake.
Set the graph axes to a better range and bring the figure forward
And with this you're ready to start drawing. Yes you already have a graph, but you need to constantly update the "y" values.
For this let's make a graph that scrolls left, with the most recent value being on the right.
Scroll left
The most recent value being on the right
Well ok, now how to get the values on the graph?
For that we use a function that edits a particular thing on the plot and then request to drawnow.
This might not seem that big of a deal, but in my tiny PC it made all the difference. Also, in this simple project you could probably get by not using this (you still need draw now though) but start adding more and more and you will start to see the difference (in the PC I'm writing this was a tiny difference from using more 6% of a dual core I7).
All Done to WorkPut all that in infinite loop and it will work. Just run the script with the launchpad connected, press the button so it starts sending data and you will have a real time plot. But you will have some problems.
- How do you stop the script without pressing CTRl+C?
- If you press CTRL+C why can't I open the port again
So I ask you to see my final code with some additions:
A way to see the numbers received in the command window of MatLab
A way so that when you press the key "s" the script ends. (if the code blocks while waiting for a byte to be available, this will not work)
Something that will delete all serial ports from MatLab memory and avoid problems when a port is not deleted due to bad script termination:
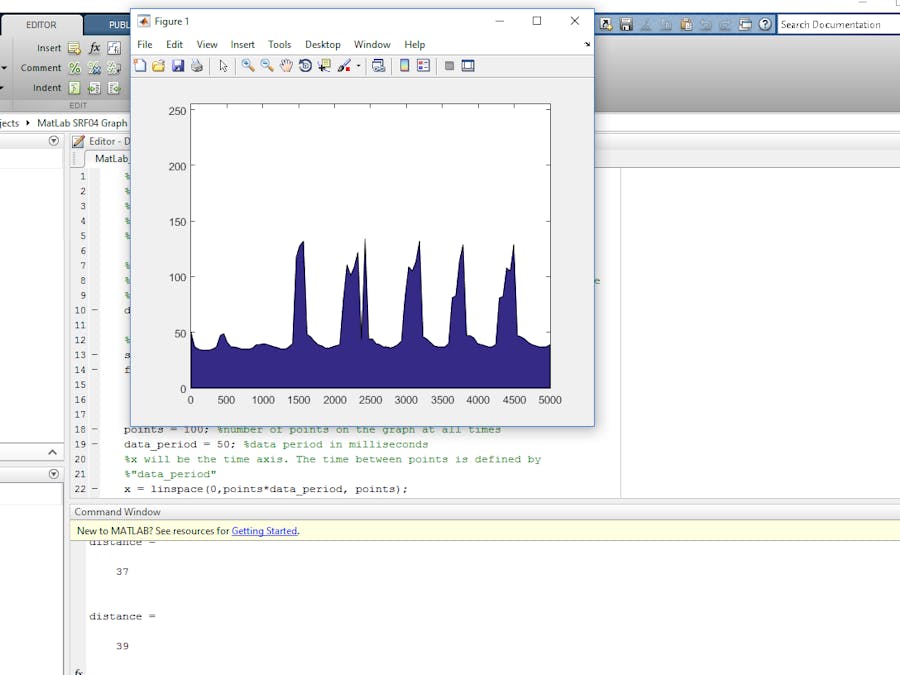
Making this the final result (note, in this video the y axis adapts to fit the values instead of a fixed 0 to 255). You can see how my tiny computer was struggling to run this as is. Final code is below btw.
The Final Code:
Well, I hope this as helped you and until next time.


Comments