

Hardware components | ||||||
_ztBMuBhMHo.jpg?auto=compress%2Cformat&w=48&h=48&fit=fill&bg=ffffff) |
| × | 1 | |||
In some cases, you want to know how much analogue signals are shifted in time against each other no matter what their amplitude may be. The standard method to give the result is called cross correlation, and it dates back to about 1920.
The BasicsFor instance, it can be used for Generalized Cross Correlation with Phase Transform (GCC-PHAT) to compute the time delay of arrival (TDOA) between two or more channels. With the small amount of memory of an Arduino, it can be done only with certain restrictions, and it depends very much on the frequencies which the signals actually contain. In case of sinusoidal signals it works quite well.
The analogue input signals can be taken either from two microphones placed at a certain distance from each other, or from a sine wave generator, one directly and the other one delayed by a high or low pass. In this case, do not forget to shift the DC level to the range between zero and five volts.
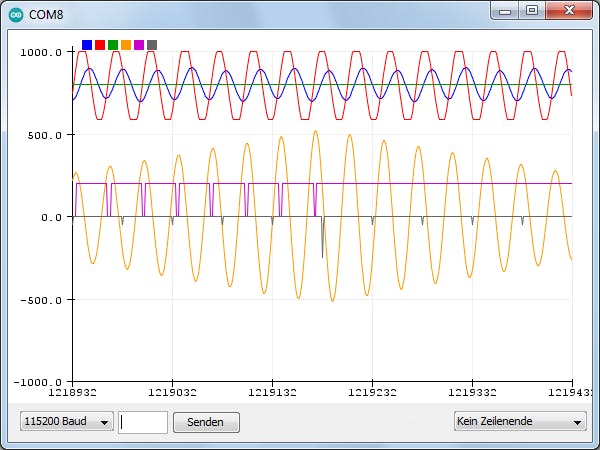
The graphic above shows the Serial plotter which displays the two signals applied to the analogue inputs (blue and red). Below you see the cross correlation function (orange), the tick marks and the centre of the interval marked (dark green) and a rectangle (violet) indicating where the maximum value of the cross correlation function is located. Only the rightmost rectangle is valid; with the restricted amount of RAM there is no way to suppress the previous rectangles. All this is done on one go using a nested loop.
for (int i = 0; i < N; i++) {
    ...
    // ----------- calculate cc --------- :
    long cc = 0;
    for (int j = 0, k = i - N2; j < N; j++, k++)
      if (k >= 0 && k < N) cc = cc + (long) a[j] * b[k];
    ...
}
Before, the samples have to be read into two arrays a [] and b[]. As the Serial plotter always shows 500 samples, that same value was chosen for the dimension of the integer arrays. So, from the 2048 bytes of SRAM just 48 bytes remain free for some variables and the stack.
There was no room for the space-consuming Serial class, so only elementary functions for printing were implemented without any luxury. Using the Serial class you only can handle up to 420 samples. At the end not a single byte was left.
#include "Tx.h"There is an option to set the sampling speed by inserting a jumper at two adjacent pins in the area of pin-2 to pin-7 which sets the ADC prescaler to values between 2 and 128 which also affects the precision of the ADC conversion.
setAdcPrescaler();The program shows the tick marks, the centre and the position of the maximum. Obviously, only one maximum can be detected properly.
The phase shift between the two signals would be the difference between the centre and the position of the maximum. Unfortunately, when you apply complex signals to the device mostly no proper phase values can be seen.
A Nice ApplicationThere might be cases when you are using two Arduinos in your project and want to operate them at the same speed. But crystals do not always oscillate at exactly 16 megahertz, they might differ by as much as 10 kilohertz or even more. So how can you detect if their frequencies match? This is how it can be done.
What you need: two (or more) Arduinos and four jumper wires.
Arduino-1 compares the frequencies and displays the results, Arduino-2 is the device-under-test. Firstly connect the power wires (GND to GND, black and Vcc to Vcc, red).
Then connect pin-9 to pin-A1 on Arduino-1 (green, right). And then connect pin-9 of Arduino-2 (blue, left) to A0 of Arduino-1. Upload this sketch to both devices.
/*
  compare crystals of two Arduinos
  Arduino-1: acts as tester
  Arduino-2: device to be compared with
  connection:
  power: GNG to GND, Vcc to Vcc
  Arduino-1: pin-9 to pin-A1
  Arduino-2: pin-9 to Arduino-1, pin-A0
  watch Serial Plotter
  Actually, you can upload this sketch
  to both devices but the output
  is only visible on device #1.
*/

void setup() {
  Serial.begin(115200);
  Serial.println(__FILE__);
  Serial.println("t1 t2 cc");
  setTimer1();
}

void loop() {
  int N = 500;
  float oneByN = 1.0 / N;
  int8_t sample[N];
  // sampling takes some 240 micros:
  for (int i = 0; i < N; i++)
    sample[i] = PINC;
  // calc cross correlation:
  int cc = 0;
  // show both traces:
  for (int i = 0; i < N; i++) {
    int8_t t1 = sample[i] & 1;
    int8_t t2 = sample[i] & 2;
    t1 = (t1 << 1) - 1;
    t2 = t2 - 1;
    cc = cc + t1 * t2;
    Serial.print(t1);
    Serial.print(" ");
    Serial.print(t2);
    Serial.print(" ");
    Serial.println(cc * oneByN);
  }
  // enable watching the plotter:
  delay(2000);
}

void setTimer1() {
  // CTC mode does not use CPU time
  TCCR1A = B01000000; // toggle = C1A on compare match
  // WGM12 is defined as 3
  byte WGM_12 = B00001000;
  byte clockSelect = 5;
  /* clock Selects and frequency
    1 8.000.000
    2 1.000.000
    3   125.000
    4    31.250
    5     7.812,5  <--- = F_CPU / 1024 / 2
  */
  TCCR1B = WGM_12 + clockSelect;
  pinMode(9, OUTPUT); // OC1A
}
Now connect Arduino-1 to your computer and select Serial Plotter (mind you: it does not work with the new IDE as its plotter only supports 50 samples).
Now let us take a close look at the results:
If you go for Arduinos with equal crystals, find one where the value of the cross correlation remains the same over a long time.

Comments