% This function displays the key points for the graph selected by the user.
function Grapher(app, index)
if strcmp(app.graphChoices(index),'Linear 1')
hold(app.UIAxes, 'off');
plot([0 .2 .4 .6 .8 1],[0 .2 .4 .6 .8 1],'ro','Parent',app.UIAxes);
app.XPoints = [0 0.2 0.4 0.6 0.8 1];
app.YPoints = [0 0.2 0.4 0.6 0.8 1];
hold(app.UIAxes,'on');
app.UIAxes.Title.String = 'Unknown Function';
app.sliderIndicator = line(0,0,'Marker','o','MarkerFaceColor',[1 0 0],'Parent', app.UIAxes);
drawnow limitrate;
elseif strcmp(app.graphChoices(index),'Linear 2')
hold(app.UIAxes, 'off');
plot([0 .2 .4 .6 .8 1], [1 .8 .6 .4 .2 0], 'ro', 'Parent', app.UIAxes);
app.XPoints = [0 0.2 0.4 0.6 0.8 1];
app.YPoints = [1 0.8 0.6 0.4 0.2 0];
hold(app.UIAxes,'on');
app.UIAxes.Title.String = 'Unknown Function';
app.sliderIndicator = line(0,0,'Marker','o','MarkerFaceColor',[1 0 0],'Parent', app.UIAxes);
drawnow limitrate;
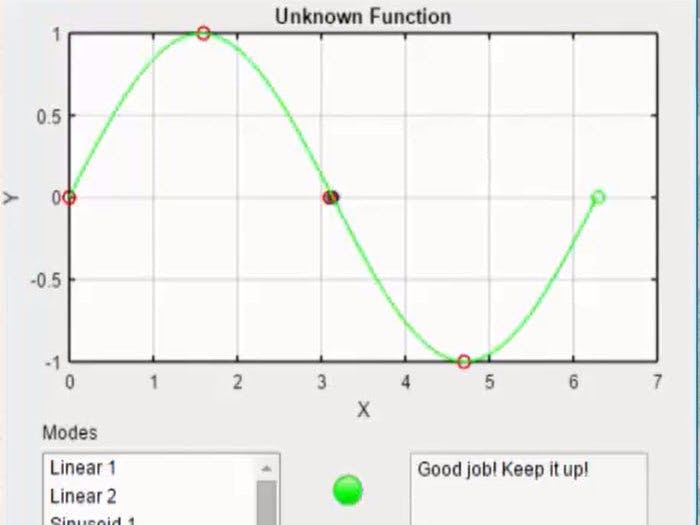
elseif strcmp(app.graphChoices(index),'Sinusoid 1')
hold(app.UIAxes,'off')
plot(round(0:pi/2:2*pi,1), round(sin(0:pi/2:2*pi),1), 'ro','Parent', app.UIAxes)
app.XPoints = 0:pi/2:2*pi;
app.YPoints = round(sin(0:pi/2:2*pi));
hold(app.UIAxes,'on');
app.UIAxes.Title.String = 'Unknown Function';
app.sliderIndicator = line(0,0,'Marker','o','MarkerFaceColor',[1 0 0],'Parent', app.UIAxes);
drawnow limitrate;
elseif strcmp(app.graphChoices(index),'Sinusoid 2')
hold(app.UIAxes,'off')
plot(round(0:pi/2:2*pi,1), round(cos(0:pi/2:2*pi),1), 'ro','Parent', app.UIAxes)
app.XPoints = 0:pi/2:2*pi;
app.YPoints = round(cos(0:pi/2:2*pi),1);
hold(app.UIAxes,'on');
app.UIAxes.Title.String = 'Unknown Function';
app.sliderIndicator = line(0,0,'Marker','o','MarkerFaceColor',[1 0 0],'Parent', app.UIAxes);
drawnow limitrate;
end
end
% This function determines whether the user selects a correct point or not and contains function calls to a majority of the game's main operations.
function CheckPts(app, index)
app.ButtonIsPressed = readDigitalPin(app.a, app.buttonPin);
if app.ButtonIsPressed && strcmp(app.graphChoices(index), 'Linear 1')
if find(app.XPoints == app.sliderIndicator.XData) == (find(app.YPoints == app.sliderIndicator.YData))
correctAnswer(app);
progressGraph(app, index);
else
wrongAnswer(app);
end
elseif app.ButtonIsPressed && strcmp(app.graphChoices(index), 'Linear 2')
if find(app.XPoints == app.sliderIndicator.XData) == (find(app.YPoints == app.sliderIndicator.YData))
correctAnswer(app);
progressGraph(app, index);
else
wrongAnswer(app);
end
elseif app.ButtonIsPressed && strcmp(app.graphChoices(index), 'Sinusoid 1')
if any(find(app.XPoints == app.sliderIndicator.XData) == (find(app.YPoints == app.sliderIndicator.YData)))
correctAnswer(app);
progressGraph(app, index);
else
wrongAnswer(app);
end
elseif app.ButtonIsPressed && strcmp(app.graphChoices(index), 'Sinusoid 2')
if any(find(app.XPoints == app.sliderIndicator.XData) == (find(app.YPoints == app.sliderIndicator.YData)))
correctAnswer(app);
progressGraph(app, index);
else
wrongAnswer(app);
end
end
end
% This function handles the case where the user selects a correct point. It keeps a log of all of the correct points that they selected on the current graph. Additionally, it handles the case where they already pressed a point.
function correctAnswer(app)
if ~isempty(app.pointsPressed) && ismember([app.sliderIndicator.XData, app.sliderIndicator.YData], app.pointsPressed,'rows')
app.Lamp.Color = 'yellow';
app.TextArea.Value = 'You already pressed that! Try something else.';
else
writeDigitalPin(app.a, app.correctPin, 1);
pause(.5)
writeDigitalPin(app.a, app.correctPin, 0);
app.Lamp.Color = 'green';
app.numCorrect = app.numCorrect + 1;
app.pointsPressed(app.numCorrect,1) = app.sliderIndicator.XData;
app.pointsPressed(app.numCorrect,2) = app.sliderIndicator.YData;
plot(round(app.sliderIndicator.XData,1), app.sliderIndicator.YData, 'go', 'Parent', app.UIAxes);
hold(app.UIAxes,'on')
app.TextArea.Value = 'Good job! Keep it up!';
end
end
% This function handles the case where the user selects an incorrect point.
function wrongAnswer(app)
writeDigitalPin(app.a, app.wrongPin, 1);
pause(.5)
writeDigitalPin(app.a, app.wrongPin, 0);
app.Lamp.Color = 'red';
app.TextArea.Value = 'Oh no! That is not correct. You should try one of the highlighted points';
end
% This function creates a graph of the function that the user is learning up to the maximum X point that they correctly selected.
function progressGraph(app,index)
if strcmp(app.graphChoices(index), 'Linear 1')
plot(0:0.2:app.sliderIndicator.XData, 0:0.2:app.sliderIndicator.YData, 'Color', [0 1 0], 'Parent', app.UIAxes)
hold(app.UIAxes,'on')
elseif strcmp(app.graphChoices(index), 'Linear 2')
plot(0:0.2:app.sliderIndicator.XData, 1:-0.2:app.sliderIndicator.YData, 'Color', [0 1 0], 'Parent', app.UIAxes)
hold(app.UIAxes,'on')
elseif strcmp(app.graphChoices(index), 'Sinusoid 1')
plot(0:pi/20:app.sliderIndicator.XData, sin(0:pi/20:app.sliderIndicator.XData), 'Color', [0 1 0], 'Parent', app.UIAxes)
hold(app.UIAxes,'on')
elseif strcmp(app.graphChoices(index), 'Sinusoid 2')
plot(0:pi/20:app.sliderIndicator.XData, cos(0:pi/20:app.sliderIndicator.XData), 'Color', [0 1 0], 'Parent', app.UIAxes)
hold(app.UIAxes,'on')
end
if length(app.pointsPressed) == length(app.XPoints)
GraphComplete(app,index);
app.pointsPressed = [];
end
end
function ButtonButtonPushed(app)
% Determine what graphs the user wants to learn
determineMode(app);
% Don't start the game until the on/off switch (slide switch) is in the 'ON' position
while 1
app.SwitchIsOn = readDigitalPin(app.a, app.switchPin);
if app.SwitchIsOn
break
end
end
% For each option that they selected, graph the key points of the function
for k = 1:length(app.graphChoices)
Grapher(app, k);
while true
% If they ever change the position of the on/off switch, end the game
app.SwitchIsOn = readDigitalPin(app.a, app.switchPin);
if ~app.SwitchIsOn
break;
else
% Determine the x and y coordinates for the user's cursor and make sure the
% y-coordinate is within the range of the Y-Axis
app.x = round(readVoltage(app.a, app.slidePin) / app.slideMax,1);
app.y = round(readVoltage(app.a, app.photoPin) / app.photoMax, 1);
if app.y >= 1
app.y = 1;
end
% If they are currently learning a Sinusoid, digitize their raw inputs
if strcmp(app.graphChoices(k), 'Sinusoid 1') || strcmp(app.graphChoices(k), 'Sinusoid 2')
SinusoidScaler(app);
end
% Update the position of the user's cursor in the game and check if they have pressed a correct point
app.sliderIndicator.XData = app.x;
app.sliderIndicator.YData = app.y;
drawnow limitrate;
CheckPts(app, k);
% If they pressed all of the necessary points, reset the graphing axes and move on the next function that they want to learn
if isempty(app.pointsPressed) && app.numCorrect ~= 0
app.numCorrect = 0;
app.TextArea.Value = '';
app.UIAxes.Title.String = '';
app.Lamp.Color = [1 1 1];
break;
end
end
end
end
% If they learned all of the functions, show them the dancing function man
if length(app.graphChoices) == 4
app.UIAxes.Title.String = 'The Function Dance!';
app.TextArea.Value = 'Check out this dance of the functions that you learned!';
pause(1);
% Create the dancing man's body
app.faceX = app.radiusOfFace*cosd(0:360);
app.faceY = app.radiusOfFace*sind(0:360) +3;
app.bodyX = 0*ones(1,5);
app.bodyY = app.radiusOfFace+1:-1:app.radiusOfFace-3;
app.leftLegX = app.radiusOfFace-1:-1:app.radiusOfFace-4;
app.leftLegY = app.radiusOfFace-3:-1:app.radiusOfFace-6;
app.rightLegX = app.radiusOfFace-1:1:app.radiusOfFace+2;
app.rightLegY = app.radiusOfFace-3:-1:app.radiusOfFace-6;
app.handX = -pi:pi/30:pi;
hold(app.UIAxes,'off')
% Show them the dance for Y = X and Y = -X
for i = 1:2
app.UIAxes.Title.String = 'Y = -X and Y = X';
app.TextArea.Value = 'Check out what Y = X and Y = -X look like!';
plot(app.faceX, app.faceY,'b', 'Parent', app.UIAxes)
hold(app.UIAxes, 'on');
plot(app.bodyX,app.bodyY,'b', 'Parent', app.UIAxes)
plot(app.leftLegX,app.leftLegY,'b', 'Parent', app.UIAxes)
plot(app.rightLegX,app.rightLegY,'b', 'Parent', app.UIAxes)
hold(app.UIAxes, 'on');
app.handY = abs(app.handX);
plot(app.handX, app.handY,'b', 'Parent', app.UIAxes)
hold(app.UIAxes,'off')
pause(1)
plot(app.faceX, app.faceY,'b','Parent', app.UIAxes )
hold(app.UIAxes, 'on');
plot(app.bodyX,app.bodyY,'b', 'Parent', app.UIAxes)
plot(app.leftLegX,app.leftLegY,'b', 'Parent', app.UIAxes)
plot(app.rightLegX,app.rightLegY,'b', 'Parent', app.UIAxes)
app.handY = -abs(app.handX);
plot(app.handX, app.handY,'b', 'Parent', app.UIAxes)
pause(1)
hold(app.UIAxes,'off')
end
% Show them the dance for Y = sin(x) and Y = cos(x)
for i = 1:2
app.UIAxes.Title.String = 'Y = sin(x) and Y= cos(x)';
app.TextArea.Value = 'Check out what Y = sin(x) and Y = cos(x) look like!';
plot(app.faceX, app.faceY,'b', 'Parent', app.UIAxes)
hold(app.UIAxes, 'on');
plot(app.bodyX,app.bodyY,'b', 'Parent', app.UIAxes)
plot(app.leftLegX,app.leftLegY,'b', 'Parent', app.UIAxes)
plot(app.rightLegX,app.rightLegY,'b', 'Parent', app.UIAxes)
app.handY = sin(app.handX);
plot(app.handX, app.handY,'b', 'Parent', app.UIAxes)
hold(app.UIAxes,'off')
pause(1)
plot(app.faceX, app.faceY,'b', 'Parent', app.UIAxes)
hold(app.UIAxes, 'on');
plot(app.bodyX,app.bodyY,'b', 'Parent', app.UIAxes)
plot(app.leftLegX,app.leftLegY,'b', 'Parent', app.UIAxes)
plot(app.rightLegX,app.rightLegY,'b', 'Parent', app.UIAxes)
app.handY = -sin(app.handX);
plot(app.handX, app.handY,'b', 'Parent', app.UIAxes)
pause(1);
hold(app.UIAxes,'off');
end
% Once the man finishes dancing, the game is over until they select another mode
app.TextArea.Value = 'Thanks for playing!';
end


_3u05Tpwasz.png?auto=compress%2Cformat&w=40&h=40&fit=fillmax&bg=fff&dpr=2)
Comments