


Hardware components | ||||||
 |
| × | 1 | |||
 |
| × | 1 | |||
 |
| × | 1 | |||
 |
| × | 2 | |||
 |
| × | 1 | |||
| × | 7 | ||||
 |
| × | 1 | |||
Software apps and online services | ||||||
| ||||||
 |
| |||||
 |
| |||||
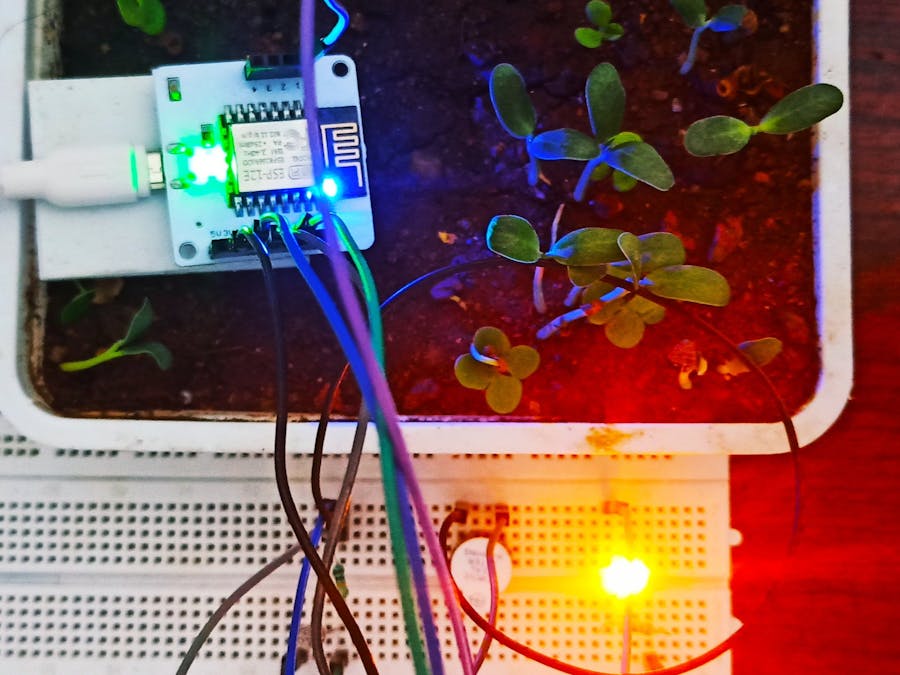
This project aims for a healthy plant growth and the function of the project is to track the amount of light falling on the plant using Light Dependent Resistor (LDR) sensor continuously and the sensed value will be updated to the user through telegram. For photosynthesis minimum 500 lux should be maintained and If the amount of light reaches critical point, buzzer goes high and If it reaches below the critical point then the LED Grow light will glow automatically with buzzer.Alert message through Telegram by the Telegram bot will be send with the condition of plant to the user and any anomaly detected it will intimate using Z-score analysis.All the above operations are done through the Bolt WiFi Module and Bolt Cloud.Data can be viewed in the form of line graph from the Bolt Cloud
2. TELEGRAM ALERT MESSAGE FROM BOT :3.1.Connecting LDR :
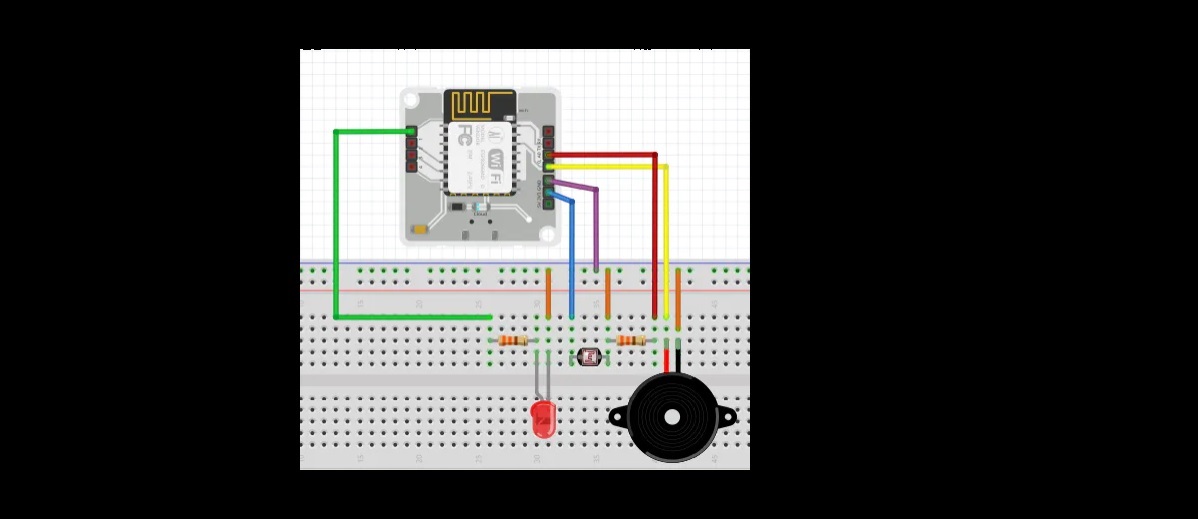
STEP - 1 : Connect one end of LDR to A0 pin through 330 ohm resistor.
STEP - 2 : Connect other end of LDR to 3.3 v pin
STEP - 2 : Connect other end of resistor to Gnd pin
3.2.Connecting BUZZER :
STEP - 1 : Connect positive end of Buzzer to pin 0
STEP - 2 : Connect negative end of Buzzer to Gnd pin
3.3.Connecting LED :
STEP - 1 : Connect positive end of LED to pin 1 through 330 ohm resistor
STEP - 2 : Connect negative end of LED to Gnd pin
Finally the circuit setup look like
- Install Telegram App
- Go to the home screen of the Telegram app and Swipe from the left side to reveal the menu.
- Click on "New Channel" and give a suitable name and description and set the channel as Public
- Enter a permanent link for your channel.
- Search for BotFather in Home screen
- Enter /start command followed by /newbot to create new bot
- Enter Bot name and Bot username.
- Final message from BotFather consist of token then save the token as telegram_bot_id
- Open the Channel and click on top to view information page
- Click on Administrators and search for your bot and add it to channel
Now your Channel and bot is ready to post messages
Z-score analysis is a method used for anomaly detection. Anomaly is detected when there is sudden rise or fall in the intensity of light falls on LDR and bounds are calculated using the sensed values, frame size (r) and multiplication factor(C).Frame size is the minimum number of input values needed for Z-score analysis and the multiplication factor determines the closeness of the bounds to the input values curve.frame size and multiplication factor can be changed.
The formulas needed for Z-score Analysis are as follows
- bolt_api_key - Go to https://cloud.boltiot.com/api_credentials and click on "Show API Key" to get your bolt_api_key
- device_id - Go to https://cloud.boltiot.com/home/ and get your id resembles BOLTXXXX
- telegram_chat_id = Available from permanent link of your channel t.me/XXXXX.Enter telegram_chat_id like @XXXXX
- telegram_bot_id = Token received from BotFather, when you create your bot
These values should be replaced in the code shown below
""" BOLT PLANT BOT CONFIGURATIONS """
bolt_api_key = "26651a77-b86d-44aa-888e-baXXXXXXXXXX"
device_id = "BOLTXXXXXXX"
telegram_chat_id = "@my_plant_status_bot"
telegram_bot_id = "bot1187250775:AAEBePFHHOie9QAoFHch1Xaj2XXXXXXXXXXXX"
critical_threshold = 500
FRAME_SIZE = 100
MUL_FACTOR = 2Data Visualization is done using Line Graph in Bolt Cloud.Go to https://cloud.boltiot.com/ and click Products -> Add Product.Enter the following and click DONE.
9.1.Hardware Configuration :
Select A0 pin and write a variable name for that pin as shown below
9.2.Code :
setChartLibrary('google-chart')
setChartTitle('BoltPlantBot Data Visualization')
setChartType('lineGraph')
plotChart("time_stamp","light");Link your Product to the Bolt device and click View your device button for data visualization in the form of line graph.You can view your data anytime on Bolt Cloud
9.3. Output :


Comments