


Hardware components | ||||||
 |
| × | 1 | |||
 |
| × | 1 | |||
 |
| × | 3 | |||
| × | 1 | ||||
 |
| × | 7 | |||
 |
| × | 3 | |||
Software apps and online services | ||||||
| ||||||
| ||||||
 |
| |||||
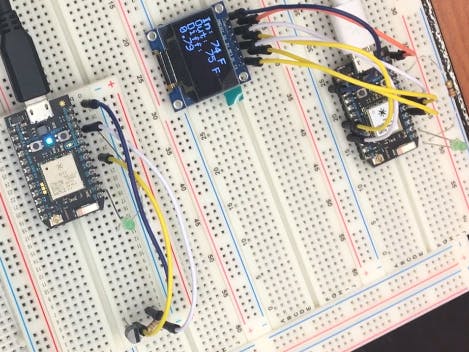
The thermo-texter was created to fulfill the need for a real time comparison system, allowing the user to simultaneously read temperatures from two separate locations. The first photon (sensor one) used in this project was placed at an indoor living space, while the second photon (sensor two) measured outdoor temperature. The third photon then receives this data and then uses it to report it back to the user through a Short Message Service (SMS). It notifies the user only when a text is sent to the device, signaled by the LED light turning on. In addition it displays this data continuously on a small LED screen, allowing the user to make decisions about the information he or she receives.
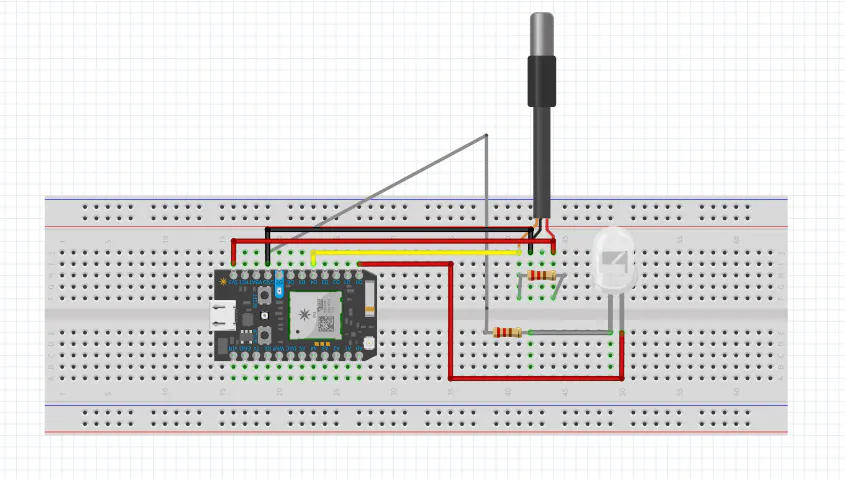
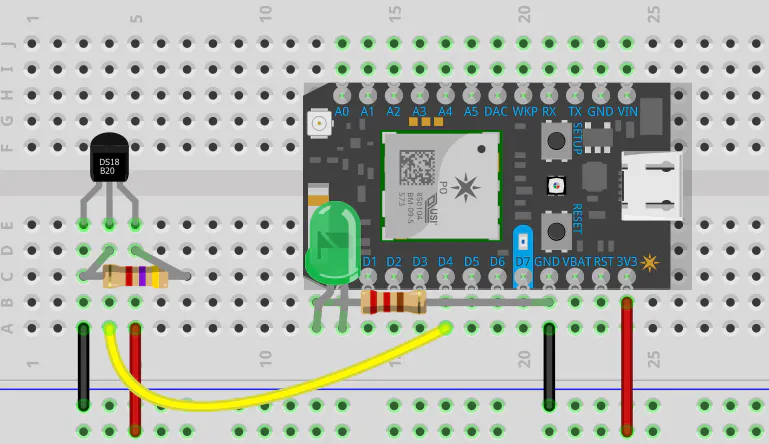
Our configuration uses an exposed and a sealed DS18B20 sensor to collect temperature data, allowing for different combinations depending on the application required. The Photon configuration containing the sealed DS18B20 is shown in the picture below.
The Primary Photon in the video funnels data from two other photons and displays the information on the OLED screen. The other two collect and transfer temperature data to the primary one. When the user requests temperature information via text, the photon's LED turns on to acknowledge the inquiry.
It's functionality can be easily expanded with additional sensors and simple changes to the programming. For example, by using sealed sensors, it could potentially be used to measure differences in water temperature in a pool or other type of liquid based circulation system where exposure to external elements needs to be avoided. Multiple sensors could be placed throughout the house allowing the user to record data on the fluctuations of temperature during different seasons and throughout different rooms. A sensor placed by the exhaust fan of a PC can be used to compare the outtake temperature to the environmental temperature of the room.
It could even be used more generally to read temperatures in different locations, or the temperature in your basement, car, garage, shed, storage unit, summer home, yacht, nuclear bunker, or evil villain lair. The possibilities are endless!
Setup of IFTTT for MessagingInformation gathered from the photon can be accessed on demand via texts by utilizing “If This Then That”. Getting started with IFFT is quite a simple process, requiring an account (https://ifttt.com/).To establish communication with the photon, there are two applets that need to be created. The first applet is the text activated event generator, which publishes an event that is later discovered by the photon.
The final configuration should appear as shown in the image above. The tag can be altered to whatever the user wants to text the photon. Additionally, the published event name should be changed here and in the code as well in order for the user to receive the events without interference from other photons.
After following these steps, repeat the process using Particle for the “This” statement and SMS for the “That” statement. Using the image below as reference, the final configuration should be as follows:
IFTTT was then used to return the data back to the user. Again, the “Event Name” should be changed here and in the code to a unique identifier, ensuring the user receives the data directly back to the photon. The device name or ID should be set to the name of the user’s individual photon and the message can be configured to output the event’s contents; any changes to the message must be made directly within the code.
Adafruit PublishingThe data is output continuously to an Adafruit graph, allowing the user to record and view both temperatures at any point in time.
Adafruit was set up through IFTTT with the setup shown below, using the “This” statement forthe Particle and the “Then” statement using Adafruit:
The above IFTTT statement looks for the inside temperature photon to publish data, and then in turn publishes the data from the inside temperature photon to a feed in Adafruit.
Two further IFTTT statements were created in the same manner as the one above, grabbing data from both the indoor and outdoor photons at the same time and sending them to feeds in Adafruit. These two feeds are then graphed in a Adafruit dashboard for a comparison of the overlaid graphs.
- Live examples of the data being displayed can be found at the following links: https://io.adafruit.com/Carud/feeds/welcome-feed
- Live Graph of Inside Temperature Sensor data: https://io.adafruit.com/Carud/dashboards/temperature
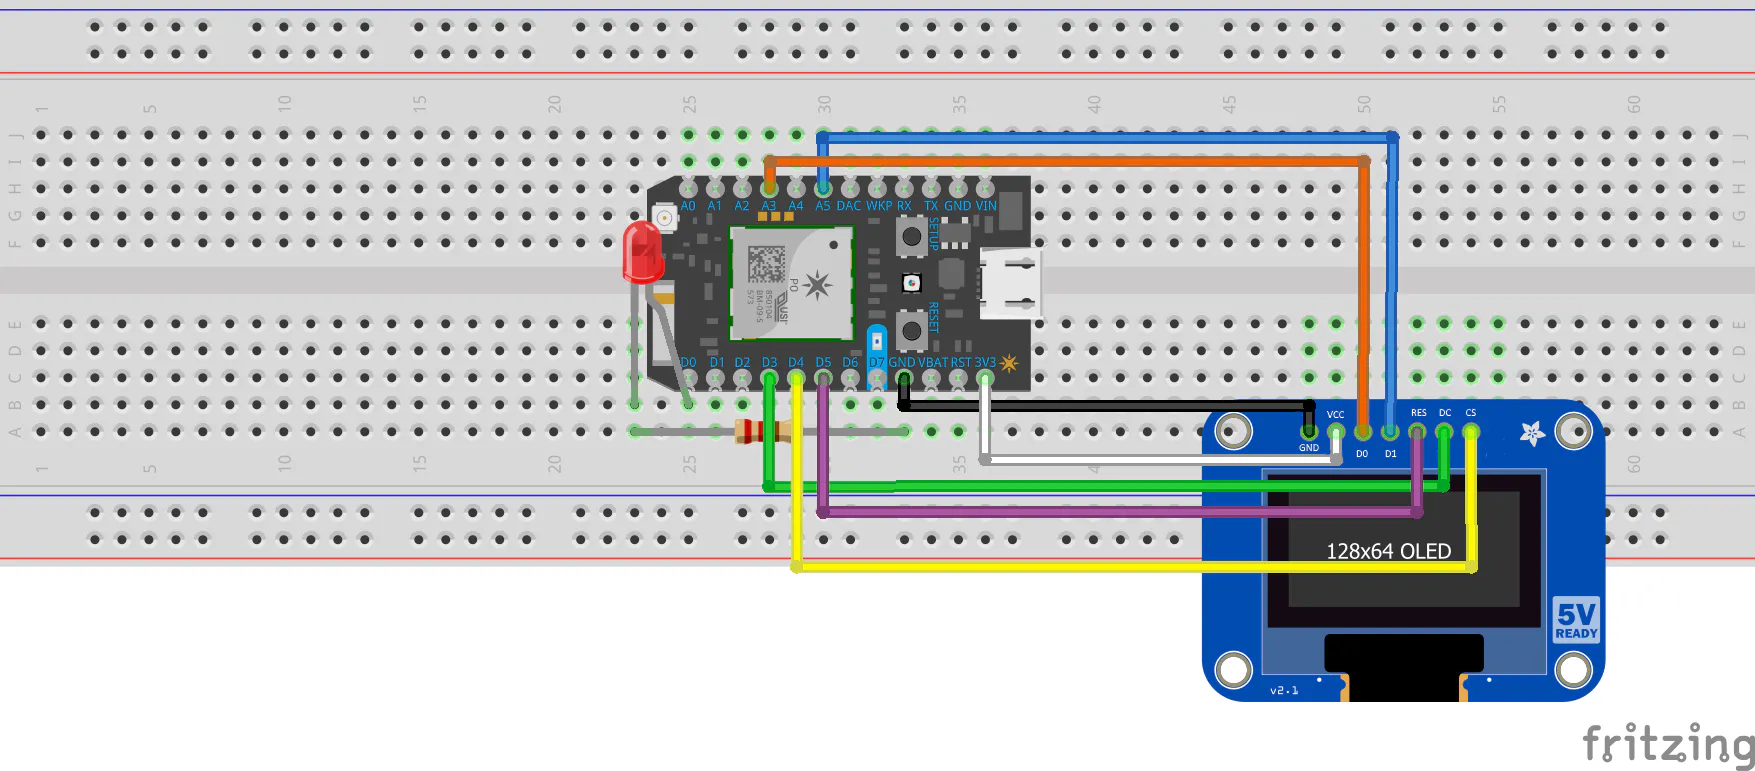
Primary Photon


Comments