


Hardware components | ||||||
 |
| × | 3 | |||
 |
| × | 1 | |||
 |
| × | 2 | |||
 |
| × | 2 | |||
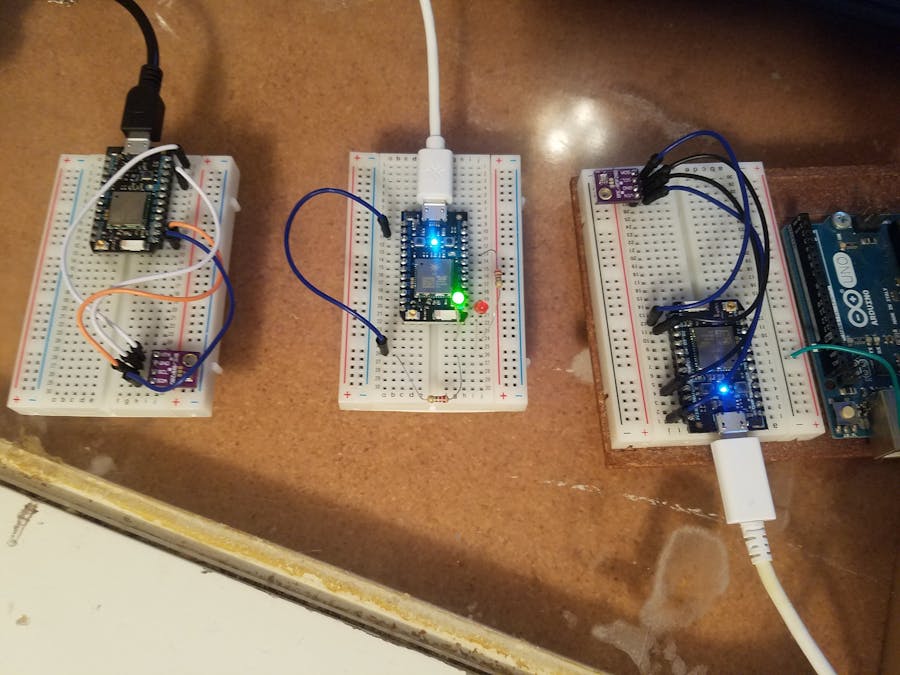
Getting an accurate picture of the current weather is usually done by trusting weather stations to give you the right information. The issue is, they don't focus on your local weather, rather the regional data. With a simple integration of IOT and the latest in components, local weather data from two photons can be obtained. By continuously averaging the data of two sensors communicating, accurate representations of your local weather can be garnished. We decided to make this project because it can be used as a valuable resource to someone who needs accurate and constantly available weather data.
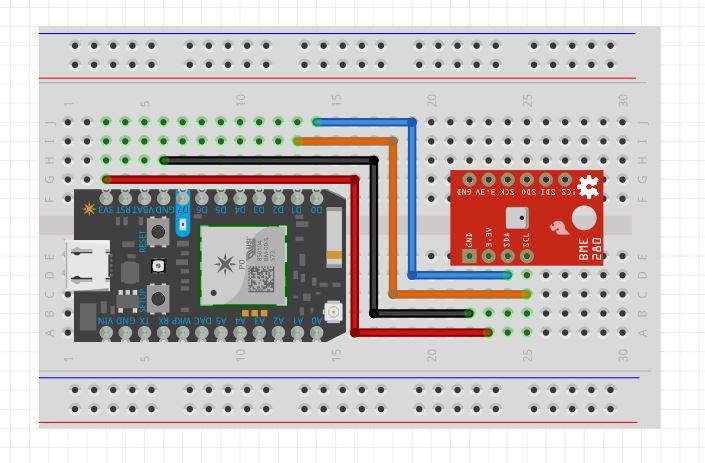
How it WorksThis project utilizes two photons to obtain information from the BME280 sensor and a third photon to monitor the Wi-Fi signal strength averaged between them. Temperature, altitude, pressure, and humidity are recorded from one location then sent to the second photon to be analyzed with the data recorded at its location. This configuration focuses on accuracy and can be used to measure inside vs. outside temperature, greenhouse/shed temperature compared to outdoors, or any other situation where two data sets are desired.
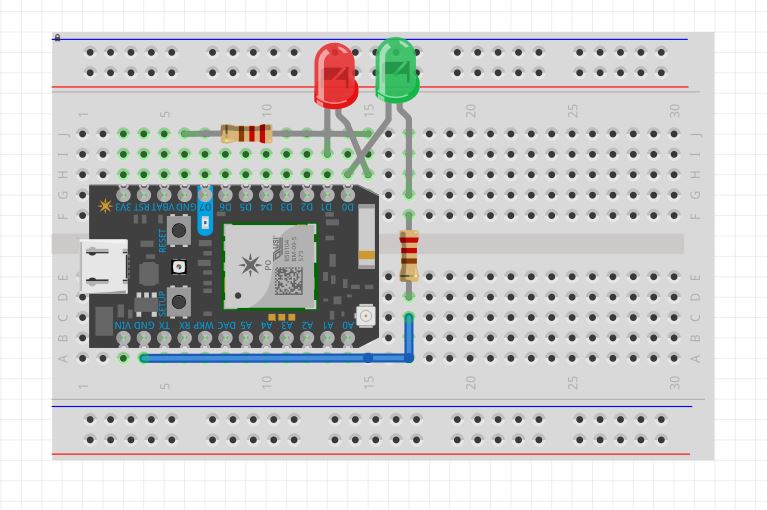
The third photon obtaining signal data can be used as a status monitor to ensure the weather acquisition devices are operating properly and within range of one another. Based on parameters defined in the code, a green LED indicates proper operation while a red LED indicates a poor connection. To give an added feature using two way communication, once the go no go green and red LED are functionally recording and comparing data, both photons collecting the data will have their D7 built in LEDS light up. If connection is lost for Go-NoGo circuit, the D7 LED will stop illuminating allowing you to see where data collection is failing, if within components.
All data is then sent to ThingSpeak where it can be viewed by the user in one convenient location
The Anchorman 1 graphs include signal strength, temperature, humidity, pressure, and calculated altitude. Anchorman 2 graphs include the previously mentioned graphs, plus the average signal strength to be sent to the "Average Signal Indicator". Thirty data points are recorded so that incoming data pushes the oldest point off the graph for a dynamic plot.
Anchorman 1 Graphs
https://thingspeak.com/channels/460910
Anchorman 2 Graphs
https://thingspeak.com/channels/462630
Using IFTTT, a text message can be sent when average signal drops below -65dB. This is to let you know that the photons may fail to publish to or disconnect from the cloud


_3u05Tpwasz.png?auto=compress%2Cformat&w=40&h=40&fit=fillmax&bg=fff&dpr=2)


Comments