
Hardware components | ||||||
 |
| × | 1 | |||
 |
| × | 3 | |||
| × | 2 | ||||
Software apps and online services | ||||||
| ||||||
 |
| |||||
| ||||||
Hand tools and fabrication machines | ||||||
 |
| |||||
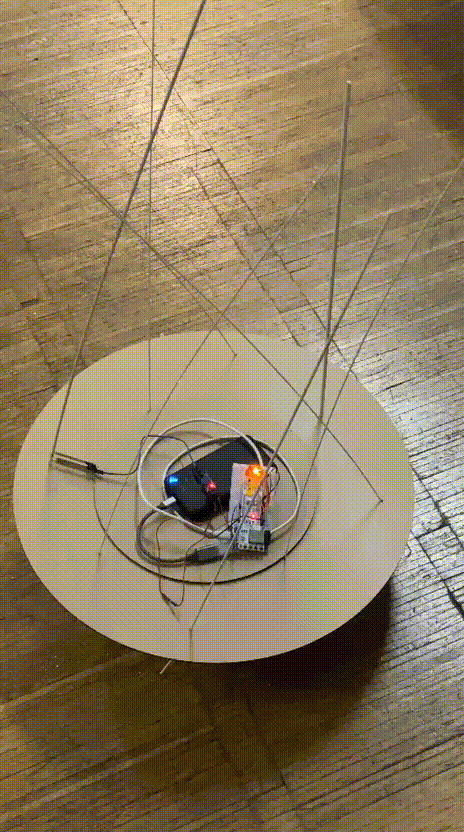
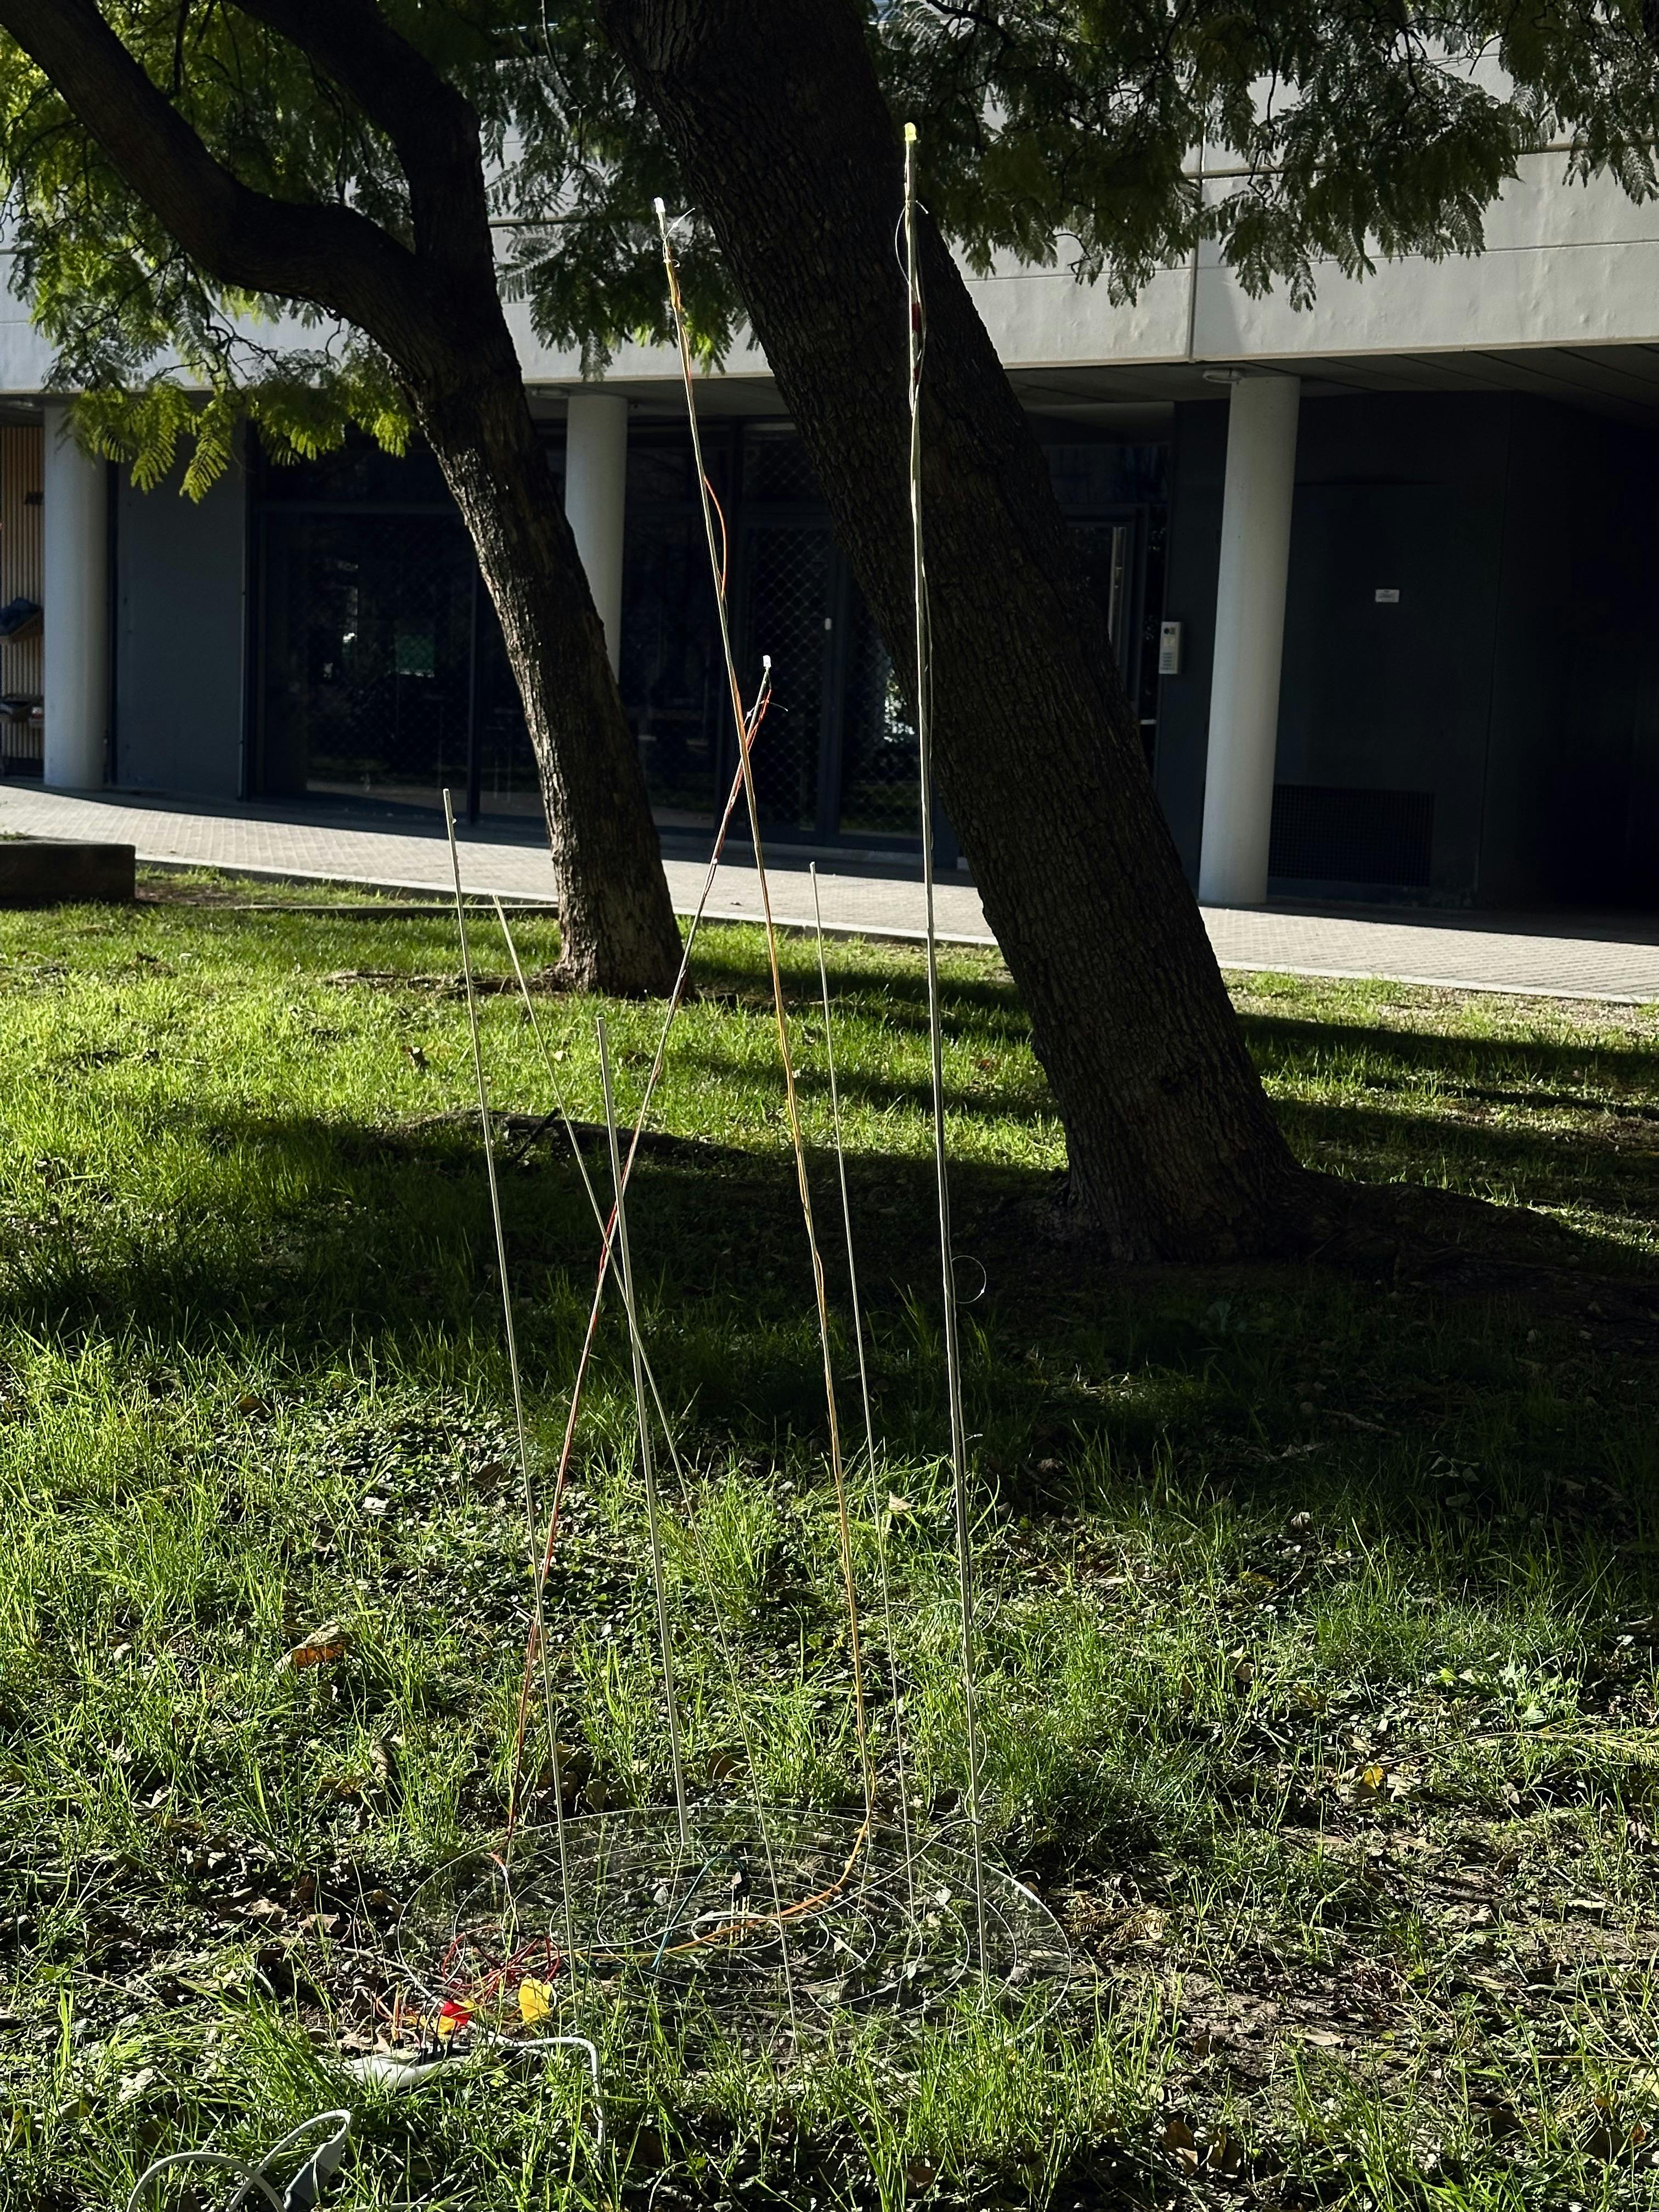
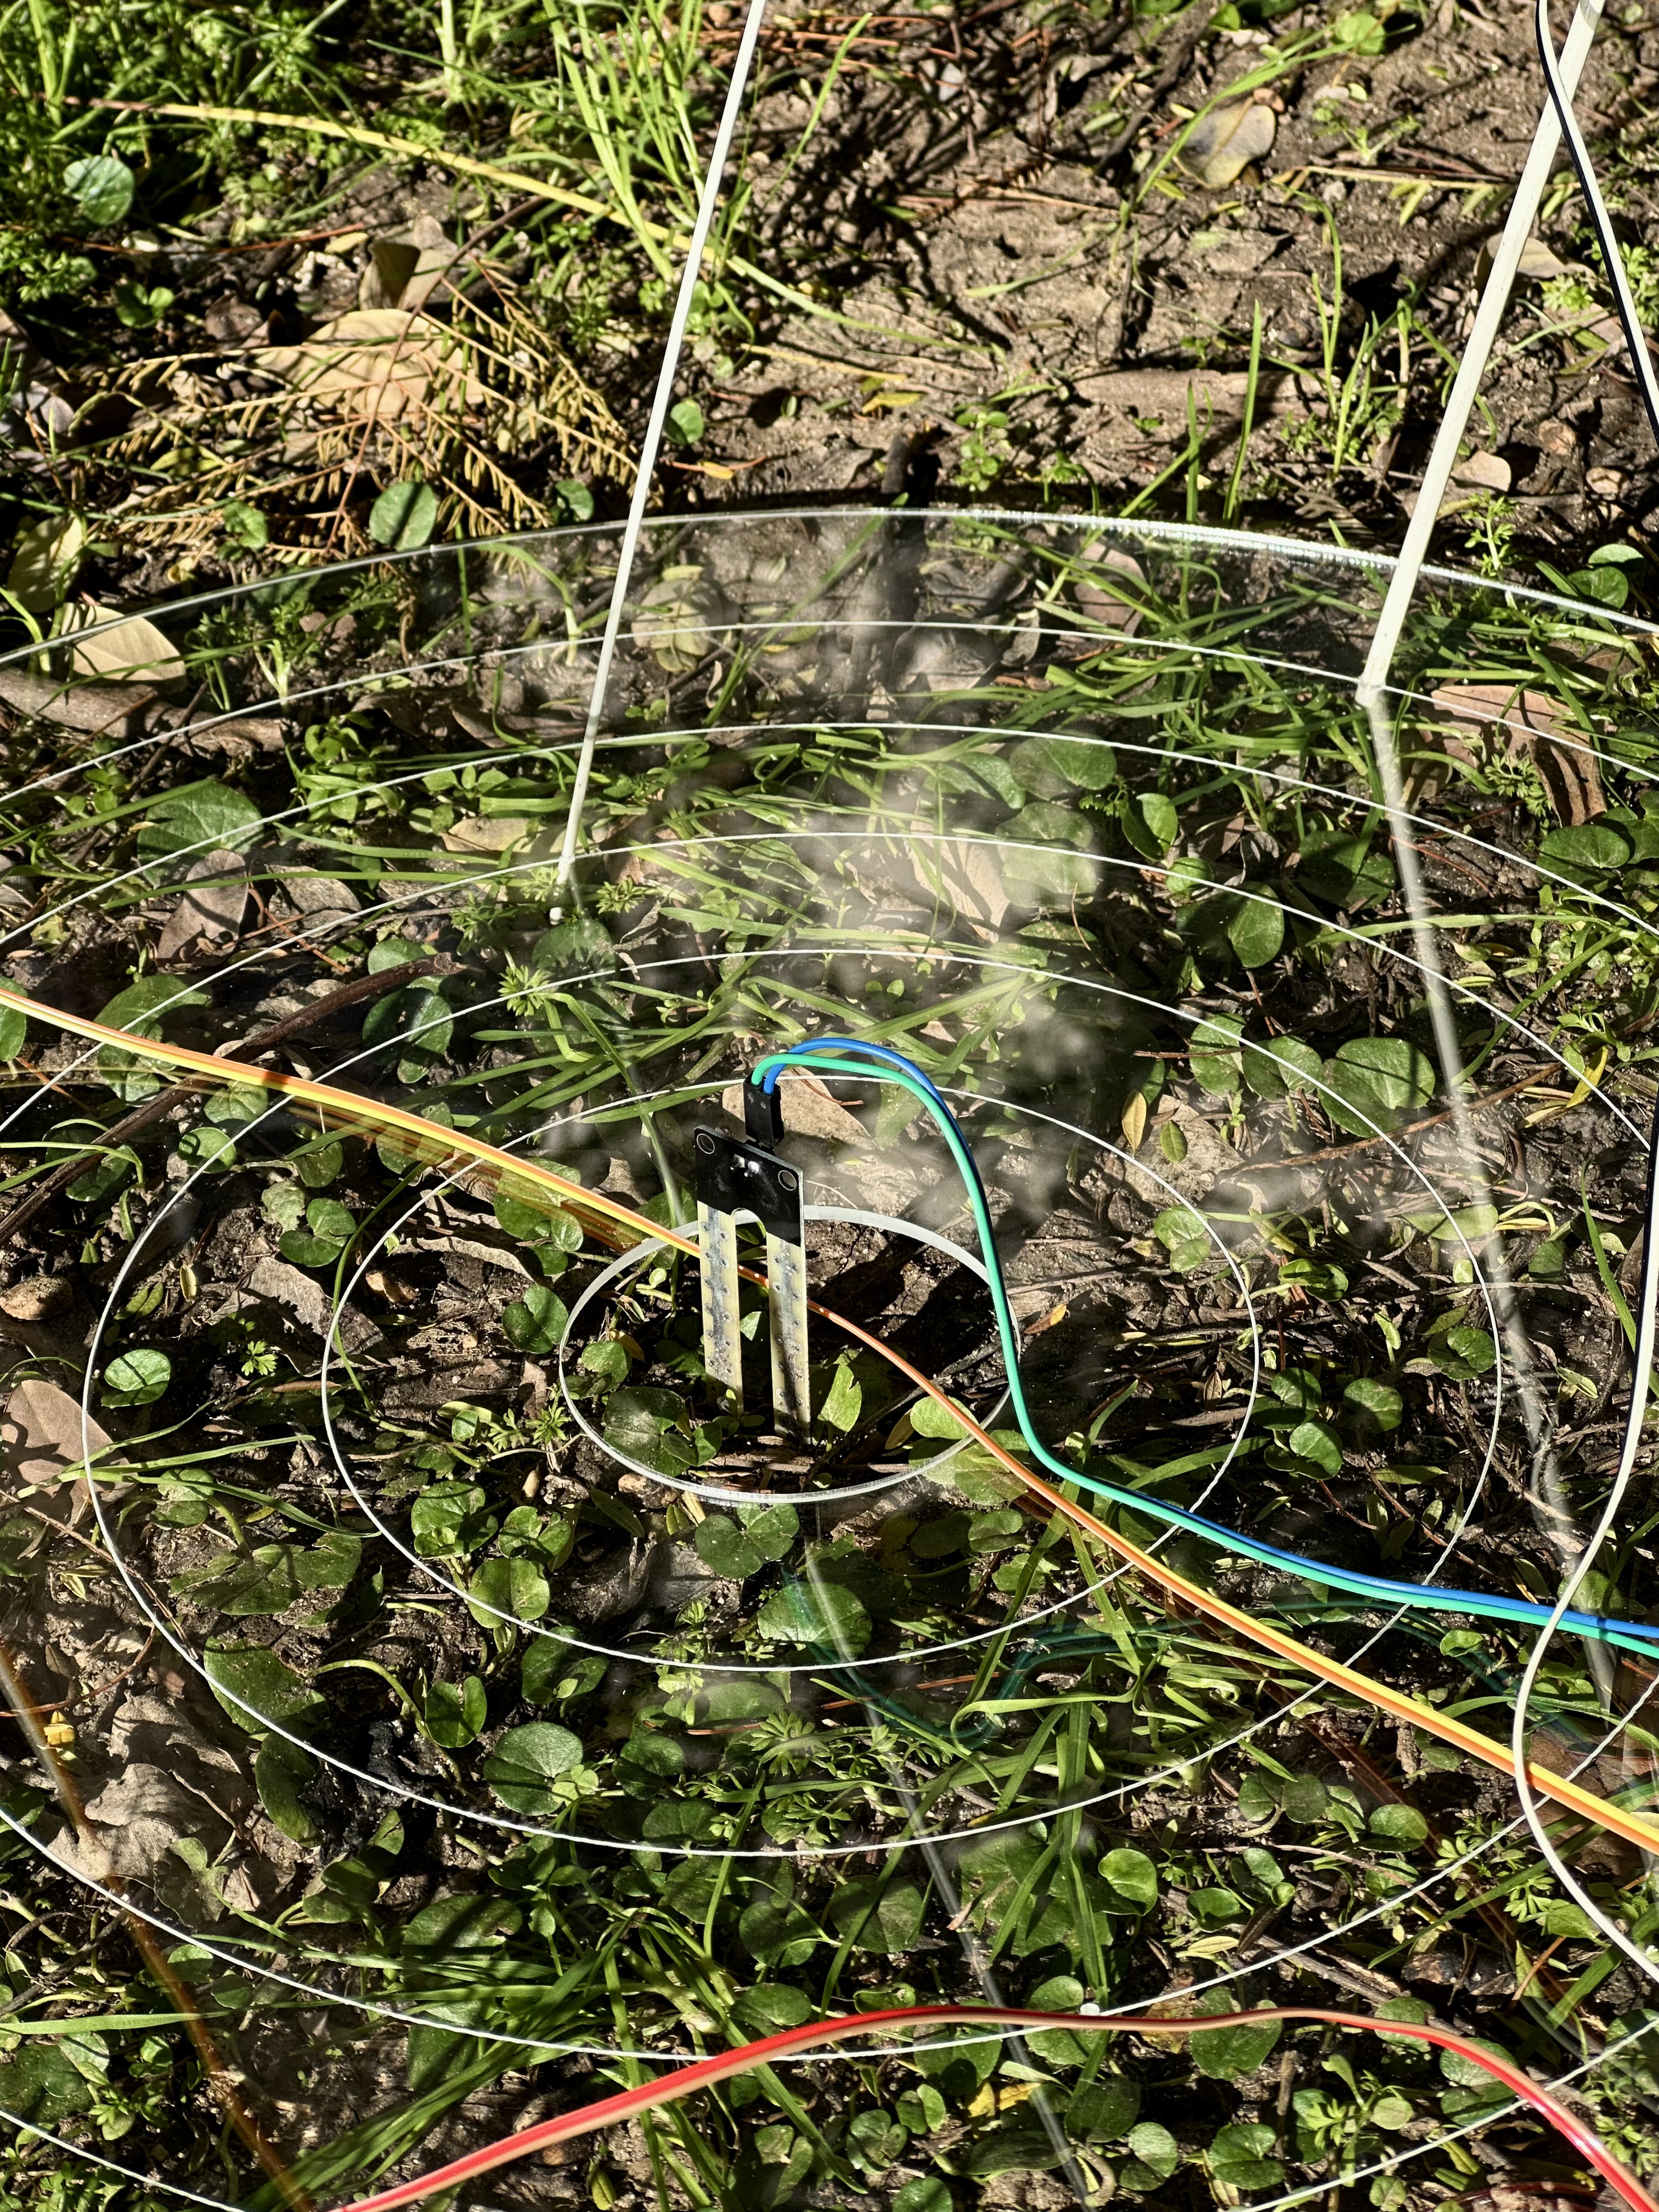
Echoes of Earth is a soil sensing device that reads ground data and visualises it through light and sound outputs. Mimicking the fireflies that fly in open fields, the sensıng devıce reflects the moisture levels and activates the lights situated on top of the reed like structure to show the sensing. To be placed outside in the field near trees, the device invites people passing it to stop and look; that there is always activity happening on the underground Earth and it is calling out to you. Adding on an extra layer, the device communicates the data remotely to a screen creating a root like structure and emitting sounds that resemble screams and hums. The visual is of a living breathing root that talks to you wherever you are.
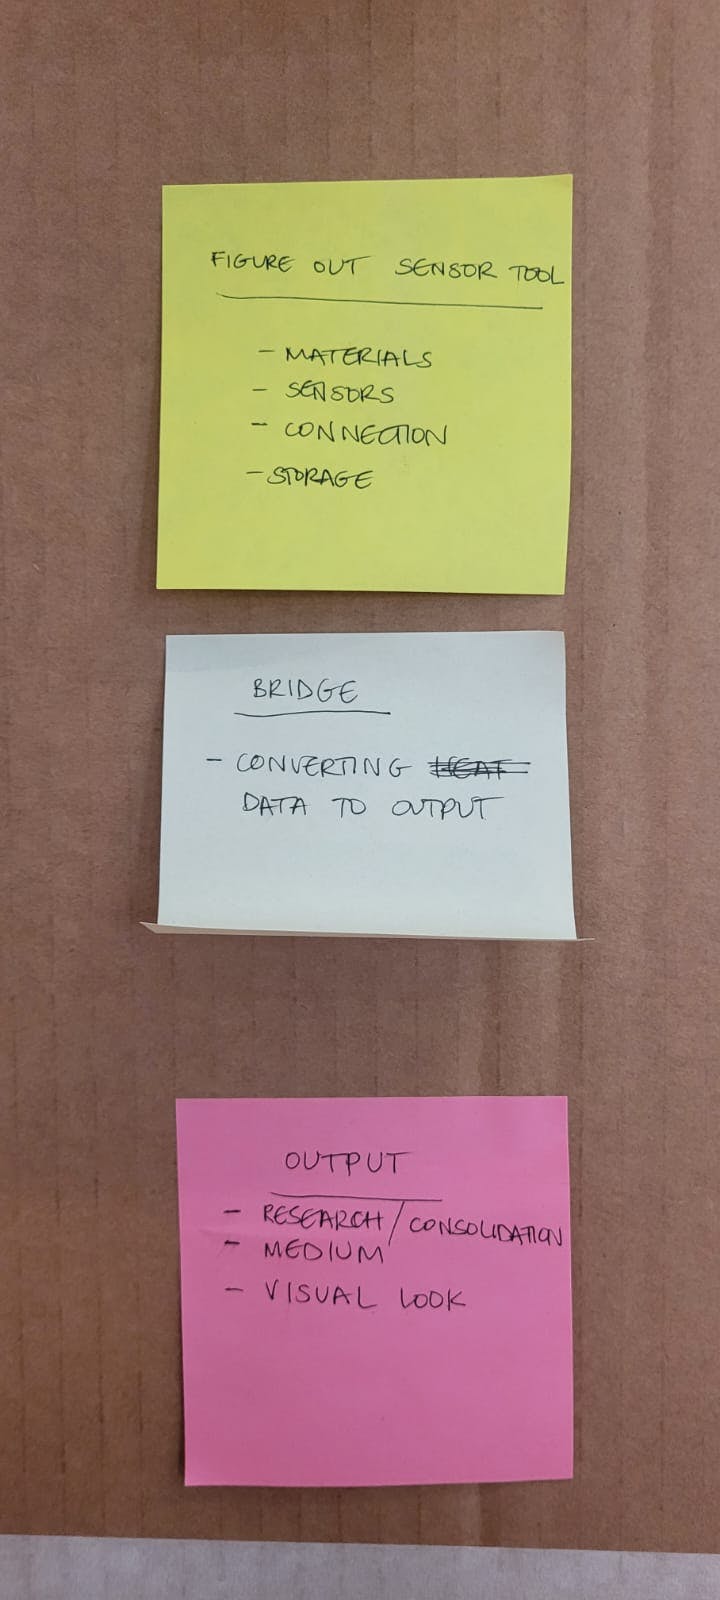
To come up with a concept, we initially mapped our shared research interests to understand our converging practices.
The common words that emerged from our interests included words like sensing, translations, grounds, surfaces, and light.
Our shared context gave rise to an idea for a sensing device to act as a portal for people who wanted to understand nature through a deeper and different lens. Urban citizens who often craved to be connected to the Earth but didn't have many opportunities to do so formed the crux of our community.
MotivationInitially, we wanted to create a device that visualises the roots of a tree underground and fosters a deep connection with the Earth. The aim was to elicit an experience ın the viewer and project activity happening within trees that was not visible in plain sight.
LimitationsTo create a DIY project that detects roots was hard with the limited technology we had. We explored sonar and radar, but the most effective way seemed to be reading data through a soil sensor.
We adapted the story according to the possibilities of the technology. We would still visualise roots, but the data we were reading from slightly differed. We also learned that roots change ionic concentration and thus modify soil conductivity, so plugging in a soil sensor to the ground and reading from it seemed to be the most viable.
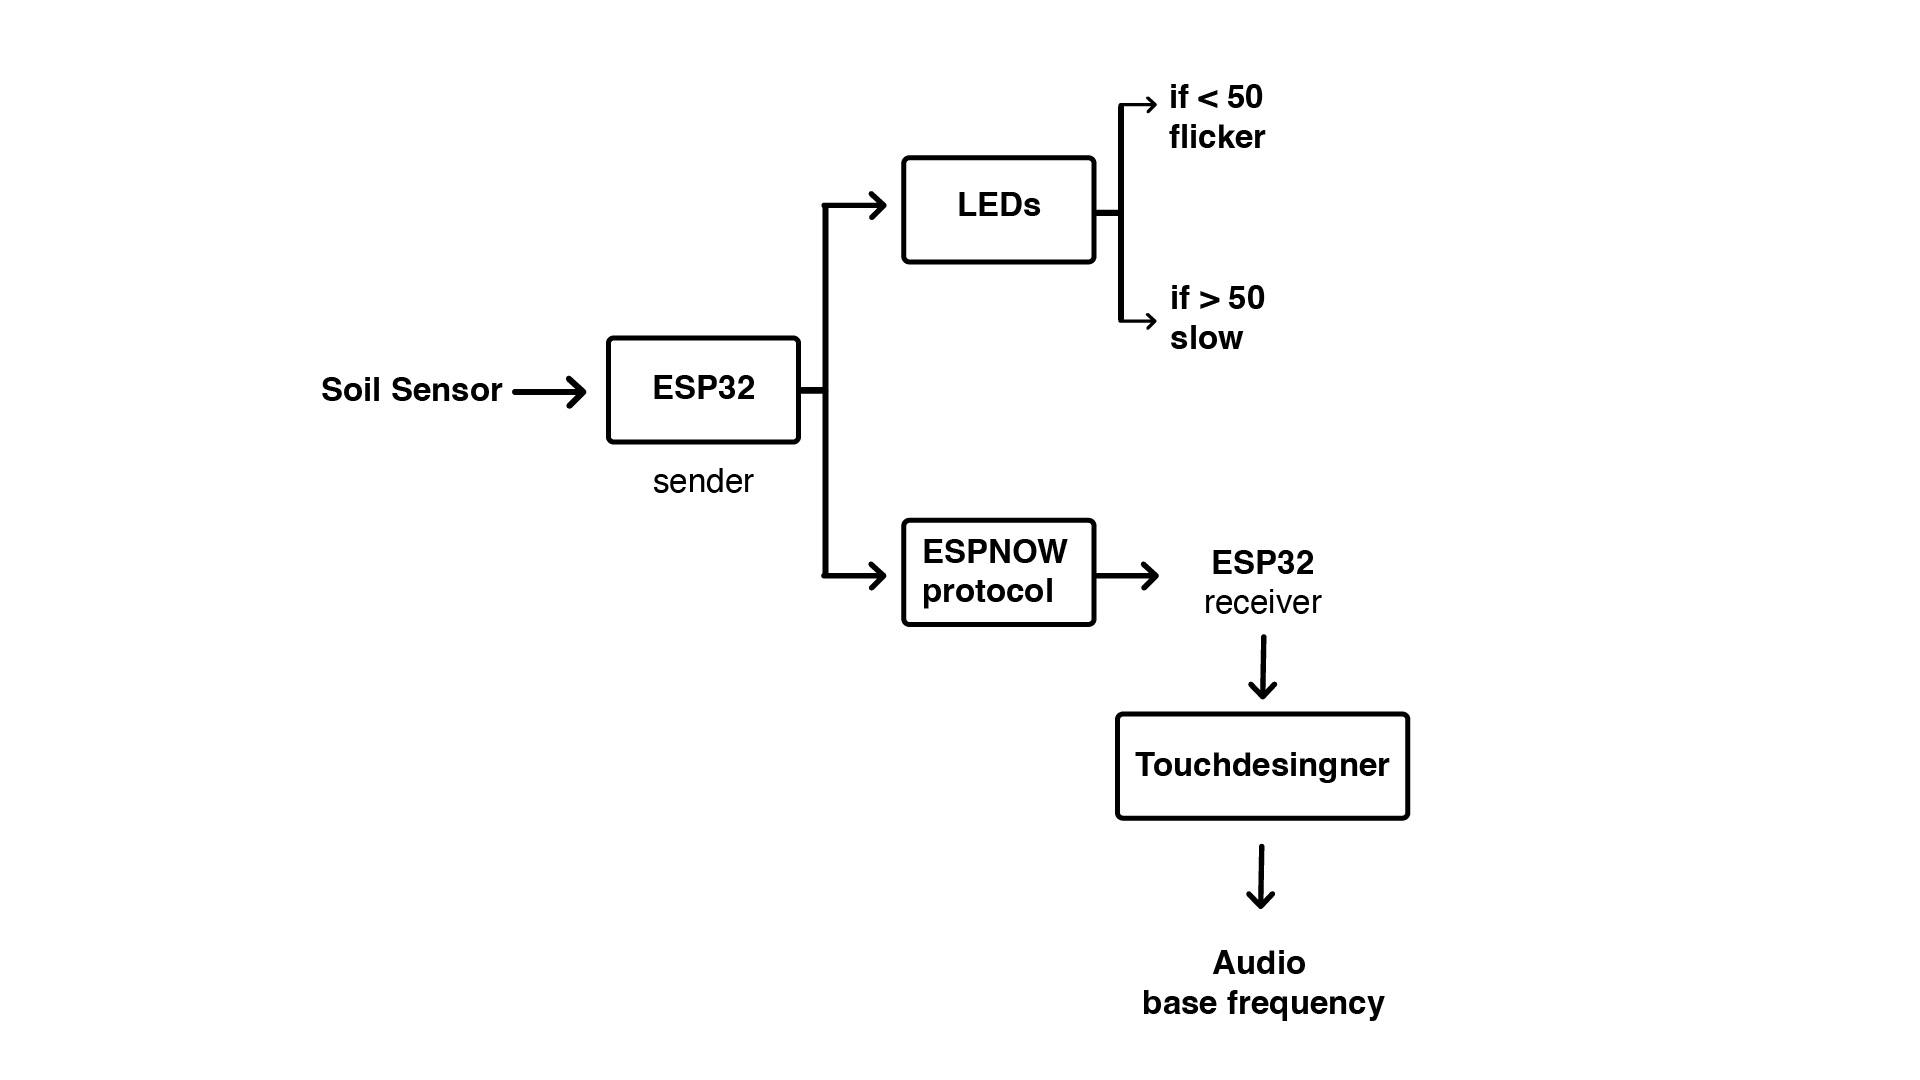
We followed a circuit diagram to activate the soil sensor using ESP32 board.
Steps
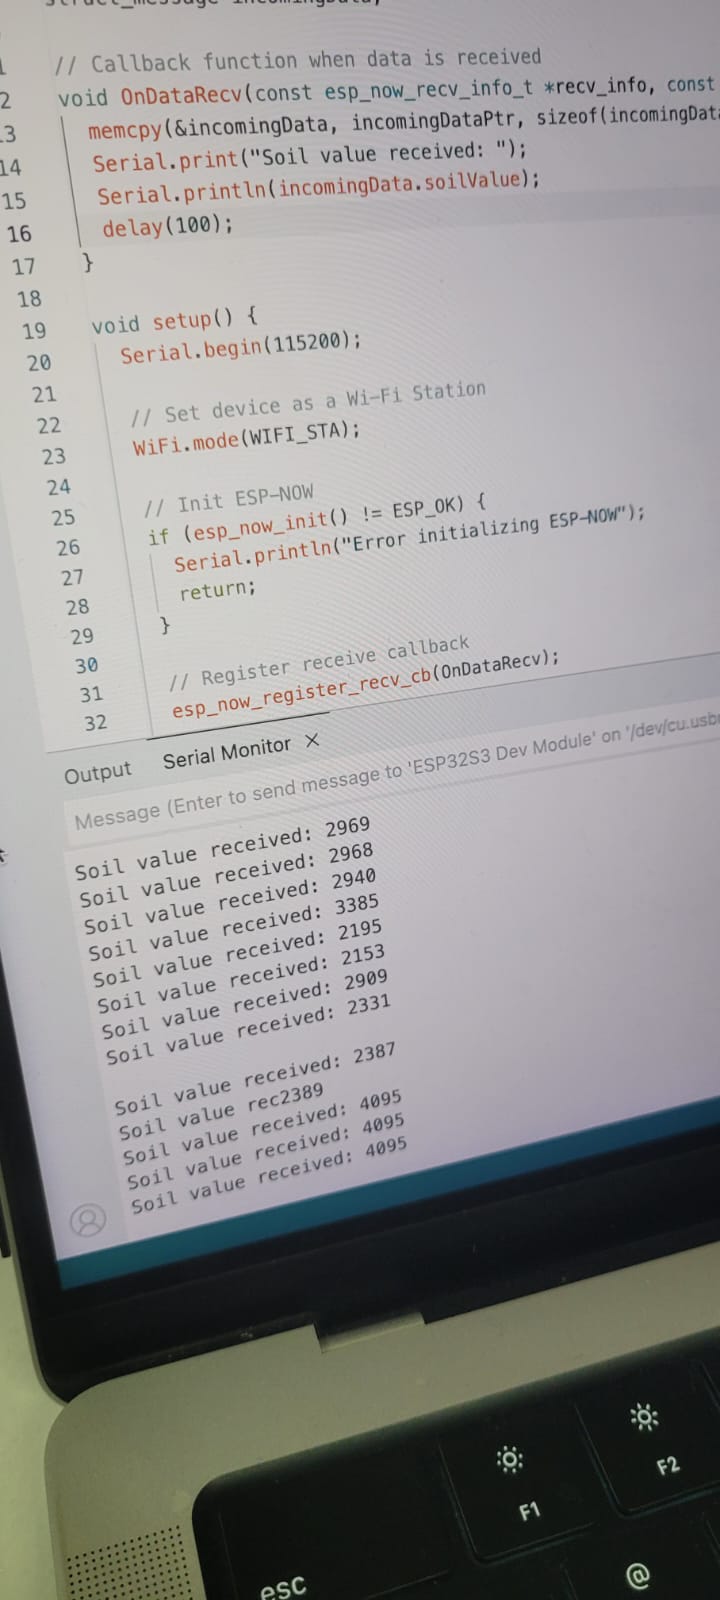
1. Connect the soil sensor to breadboard and laptop.
2. Run arduino code to read the analog values from the sensor.
3. Print values on serial monitor.
4. Check if the values were shifting according to moisture levels by testing it with a wet tissue paper.
5. Repeat the test on dry, moderate and wet soils.
2. Adding LEDsSteps
1. Connect the LEDs in series to the same breadboard.
2. Run arduino code to read the sensor and setup logic to reflect the led flicker accordingly.
LED flicker modifications
1. Using millis() instead of delay()
While the ESP32 was trying to read the soil sensor values and make the LED flicker accordingly, there was a lag in reading the data and making the lights flicker at the same time. We understood that the problem was that the arduino was stopping its "thinking" while making the lights flicker. To prevent this, our mentor Mikel suggested we use millis() instead of delay().
2. Use constrain.map()
The values of the soil sensor data ranged from 1900- 4095. Instead of setting up the logic for the LED flicker to read the same values, we mapped the values on a range of 0-100, which made it easier for the flicker as well as to work with the TouchDesigner outputs.
3. Connecting the ESP32 to communicate with receiverSteps
1. Obtain mac address of the two individual boards.
2. Update a sender sketch with a test data.
3. Update a receiver sketch.
4. Check on serial monitor of receiver.
4. Live data controlled Visual ExperimentationWith lots of tutorials and help from our colleague Armin, we constructed the skeleton of the visuals document on Touchdesigner.
We started without a specific image in mind and instead played around with different properties.
Using an image from the dataset as a reference, we created our own visual animation to achieve the effect of roots forming.
Once the visual was approved by all of us, we connected the live data readings and first focused on generating audio from the changing values (the values affect the base frequency levels). This resulted in an interesting output that sounded like the roots were screaming.
We also wanted the data to affect the visual itself. Since we already had a moving image we were happy with, it was tricky deciding which property the values should influence.
We eventually decided on particle turbulence frequency. When the data value is at zero, the particles are more scattered, and as the sensor enters the soil the turbulence decreases, allowing the image to slowly form.
Challenges1. Live reading the soil sensor data after attaching to the LEDs was challenging.
2.Connecting soil sensor values to visual output on Touchdesigner was harder than sound output.
3. Combining the code to work together.


Comments