As the use of data becomes more prevalent, we have decided to indulge ourselves in an environment in which we are able to collect, analyze, and present data.
Based off of the larger scale project, Array of Things (https://arrayofthings.github.io/# ), we, the computer science students of Lane Tech, have taken on a similar project of collecting data around the school and turning that data into useful information that have the potential to make changes to improve the environment here.
This particular project consists of CO2, temperature, and humidity sensors.
What we StudiedWe were studying the cyclical pattern of Carbon Dioxide in the school's aquaponics room. This was an interesting question to us because we felt that it would likely change depending on whether or not school was in session or if there were kids inside the classroom.
The Prototyping StageWe started our project by testing the various sensors we were using on the breadboard, as seen in the pictures below. This was fairly successful as we had already used the DHT22 temperature/humidity sensor before, however we ran into some issues with the LED and the MQ135 sensor. We learned that it was near impossible to calibrate the MQ135 sensor without either a vacuum or 100% Carbon Dioxide chamber, so we were only able to compare it to another groups MQ135 sensor. AS for the LED, despite having used an rgb one before ours simply gave us various issues that we couldn't quite figure out and seemed to just fix themselves by the end.
Code, Code, and Code Some MoreAs far as the coding went, it wasn't all that difficult. Luckily the MQ135 sensor already had a Photon library that allowed us to quickly calculate the CO2 level in parts per million, and the rest was simply figuring out how the Phant database worked.
Experimenting with photon and sensors
Another angle, with the LED on
After the breadboard was fully working and outputting data to the Phant database, we began working on the enclosure. Our first prototype is pictured below, as we planned to have our sensors inside the enclosure with holes providing airflow on the box. This changed later on, when we decided to put the sensors outside the box which eliminated the need for as many holes.
Early sketch of enclosure
Where we left our sensor to take data
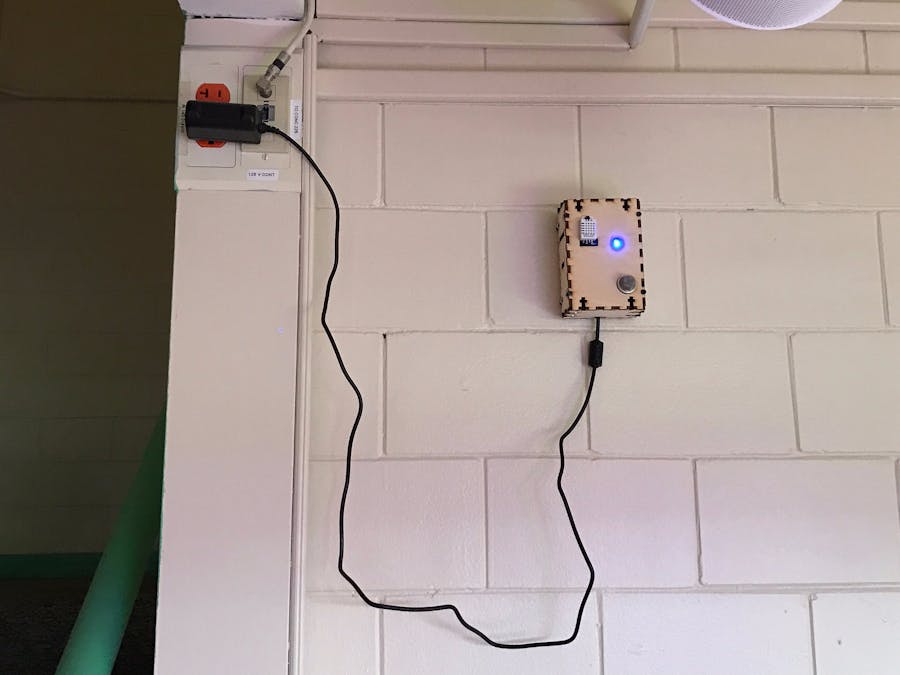
Sensor box hanging in the aquaponics room of Lane Tech
CO2 (GREEN) vs. Temp (BLUE) vs. Humidity (BLACK)
Temp (BLUE) vs. Humidity (BLACK)
Temp (Red) vs. Humidity (Blue) vs. Time
Interestingly, there was a weekly peak in Carbon Dioxide levels. On Monday, April 10 around 9:30 and Monday, April 17 at around 10:30 CO2 Levels peaked to a staggering 1300. This is very interesting because CO2 at those levels can be dangerous, however the sensor was not properly calibrated so it's possible that these peaks are much lower than the 1300ppm recorded. Also interesting is how Humidity and Temperature appear to be inversely related.
You can check out our raw data here.
What We LearnedOverall, we learned a lot about how CO2, temperature, and humidity are related, as well as just how delicate some sensors can be. What we mean by that is how even the type of wire used to connect the sensor to the Photon or the power source can affect the data that the sensor outputs. Regardless, we learned to work through those issues and learned a lot.


Comments