


Hardware components | ||||||
 |
| × | 1 | |||
| × | 1 | ||||
 |
| × | 1 | |||
| × | 1 | ||||
Introduction
We are part of the Lane of Things 2016-2017. Our class was tasked with creating a "mote" - a device which uses sensors to collect data about our school - for this year's iteration of the project. Having participated in the same project during the 2015-2016 school year, we were held to higher standards. Because of this, we decided to create a project which benefited from the amazing opportunities we are afforded at lane tech. Our proposed idea was a sensor which would monitor the water quality (turbidity) and temperature of our aquaponics lab's fish tank. Ideal temperature and water clarity are vital to the survival of young fish. We wanted our sensor to act as an early warning system for critical failures in the lab's water system.
Planning
At first, we wanted to include a pH sensor and an ammonia/nitrite sensor, but unfortunately those components were not within our budget. We settled on a waterproof temperature probe and a turbidity sensor. Next, we sketched up a prototype to lay out exactly where we wanted the sensors to be planted. it also helped us get a look at what type of enclosure we would end up building.
We also made a fritzing diagram. We had to make some modifications as the specific sensors we were using were not included as components in fritzing.
After this, we ordered the parts and began work on an initial enclosure prototype.
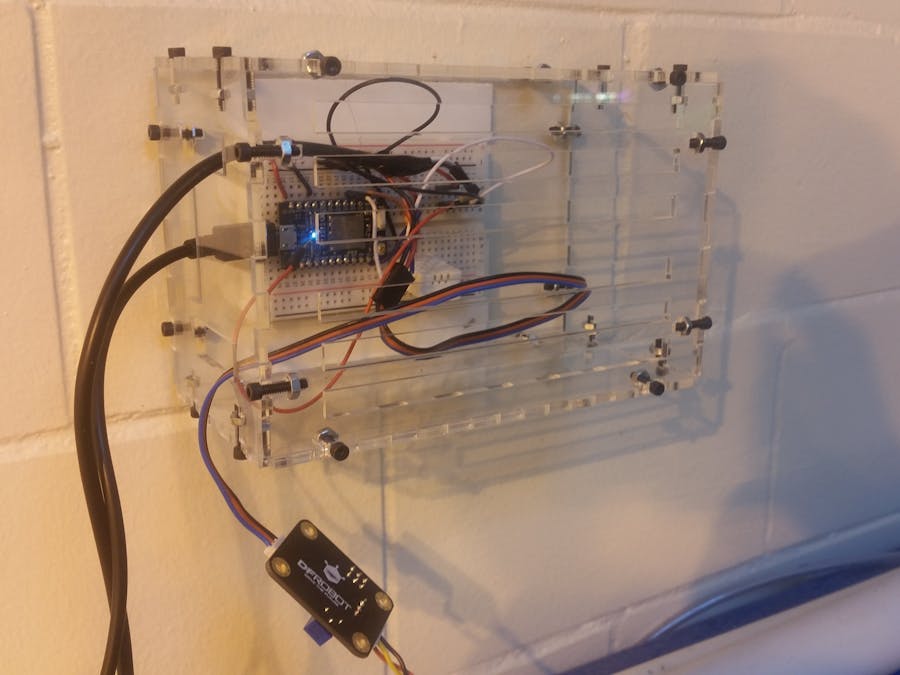
Prototype
Coding
When coding the project we used the libraries found in the photon IDE. Although we ran into some snags with the ds18b20 sample code, we found a way to write a program from scratch which worked perfectly. We repurposed parts of the sample code which we tested using a glass of water. The rest of the components worked right away. The fact that the turbidity sensor is analog helped a lot with this! Included below is our code for the project.
Final
Our final enclosure ended up having long slits for airflow instead of holes as we felt that we went overboard with the number of openings in our prototype.
We used t-slots in our design since they are very sturdy and easy to disassemble. Gluing the enclosure was not an option since we needed a way to remove the electronics after the data collection was finished.
Data Collection
Once the mote was set up, we began receiving data. We decided to collect data from the sensor in a spreadsheet every minute, as we wanted the data to be accurate and frequent in case the sensors detected a rapid change in water quality which could endanger the goldfish. We ended up with ~27000 data points by the end of the project.
https://docs.google.com/a/cps.edu/spreadsheets/d/1ChlBu9m8kusc6B_FdVnNDrUFO_8-ejRlc5bpIe3vDqM/edit?usp=sharing <---- Link to the spreadsheet and data visualization for this project.
Conclusions
If we were to do this project again, we would work faster and more efficiently. Even with our experience from the previous iteration of the Lane of Things project, we ran into snags which delayed our deployment of the sensor. Our data did not reveal any tampering or major failures in the aquaponic system (which is good) and we are confident that the mote would have detected a major problem if it had occurred. We are considering leaving the mote up over the summer when power to the aquaponic system is most likely to be accidentally shut off.


Comments