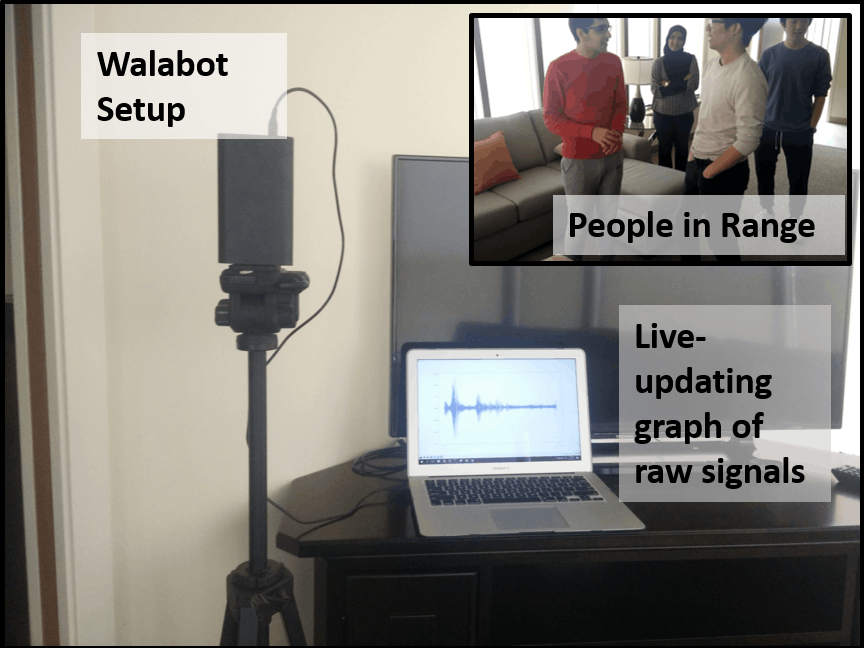
Fezza HaiderGeorge Shaker
Published

People and Fall Detection with Walabot

A system for detecting up to 5 stationary people simultaneously and determining if someone has fallen.

AdvancedFull instructions provided3 hours4,746
People and Fall Detection with Walabot

Things used in this project

Hardware components

Walabot Developer Pack
×1

Story

Read more

Schematics

TOF csv file

This file is needed for the Heatmap python script to work properly. The filename should be changed to 'TOF'

Code

DataCollection.py

Python
# --------------------------------------DATA COLLECTION-------------------------------------------
# |   File: DataCollection                                                                       |
# |   Type: .py (python)                                                                         |      
# |   Purpose: Subtracts an initially recorded background from newly collected data and saves it |
# |   into a csv file called 'raw_data'
# ------------------------------------------------------------------------------------------------


from __future__ import print_function
from sys import platform
from os import system
import WalabotAPI as wlbt
import matplotlib.pyplot as plt
from drawnow import drawnow
import numpy as np


# _______________________________________________________________________________________________________
#|                                            COLOR MATRIX                                               |
#| ______________________________________________________________________________________________________|

# The matrix with 40 different colors; this is to be used later when plotting data from the antenna
# pairs. THe size of this matrix is 40 because that correlates with the total number of available 
# antenna pairs.
COLORS = [
"000000", "0000FF", "DC143C", "00FFFF", "008000", "0000FF", "ADD8E6", "F8F8FF", "F0FFF0", "6495ED",
"6A5ACD", "FAF0E6", "00008B", "B0E0E6", "2E8B57", "BDB76B", "FFFAFA", "A0522D", "0000CD", "4169E1",
"E0FFFF", "008000", "9370DB", "191970", "FFF8DC", "AFEEEE", "FFE4C4", "708090", "008B8B", "F0E68C",
"F5DEB3", "008080", "9932CC", "FA8072", "00BFFF", "663399", "8B0000", "4682B4", "DB7093", "778899"]


# _______________________________________________________________________________________________________
#|                                     INITIALIZING/CNNECTING WALABOT                                    |
#| ______________________________________________________________________________________________________|


# Load the python WalabotAPI into the program as 'wlbt' and initialize it
wlbt.Init()
wlbt.SetSettingsFolder()

# Establish a connection between the Walabot and the computer
wlbt.ConnectAny()

# Set sensor profile
wlbt.SetProfile(wlbt.PROF_SENSOR)

# Set filtering to none
wlbt.SetDynamicImageFilter(wlbt.FILTER_TYPE_NONE)


# ________________________________________________________________________________________________________
#|                                    GET ANTENNA PAIRS AND START WALABOT                                 |
#| _______________________________________________________________________________________________________|


# Get the list of antenna pairs that are available and store it in an array
pair = wlbt.GetAntennaPairs()

# Start the Walabot device
wlbt.Start()


# ________________________________________________________________________________________________________
#|                                              LIVE-UPDATING GRAPH                                       |
#| _______________________________________________________________________________________________________|

# 'ant' stores the number of antenna pairs to be used for data collection
ant = 40

# This command creates a new csv file "raw_data.csv" if one does not exist in the program directory and in 
# the case it already does exist, it overwrites it
f = open("raw_data.csv", "w+")

# Initializing a zero-filled array, which is then updated with the collected data. The size of the array
# depends on the number of antenna pairs to be used.  
signal_list = [[0]]*ant 
new_signal_list = [[0]]*ant
background = []
summation = []


# Initializing the figure window for plotting
plt.ion()  
fig = plt.figure()
              
   
# The custom-made function to plot the data, depending on the number of antenna pairs chosen
# function for a lot of data (PROF_SENSOR PROFILE)

    # The for loop goes up to the size of 'ant', which is the number of antenna pairs, so that
    # the loop can plot data from every antenna pair used.
       # 'timeAxis' is a 1D array contining the time domain values for the obtained raw signals. 
       # 'new_signal_list' is a multidimensional array (the number of dimensions is equal to antenna
       #  pairs being used). Each element of the array refers to the obtained signal values for
       #  the correspoding antenna pair. For example, if the 'number' is 3, then the backscattered
       #  amplitudes btained from teh 3rd antenna pair will be plotted. 
       # 'COLORS' is used to change the line color for each antenna pair. 

def makeFig():
    for number in range(ant):
       plt.plot(timeAxis[::25], new_signal_list[number][::25], '#'+COLORS[number], linewidth=0.5)


# ________________________________________________________________________________________________________
#|                                                 CALIBRATION                                            |
#| _______________________________________________________________________________________________________|
# Scans the arena 10 times and takes the average of those scans for the background signals' frame


print("Calibrating")
# Lets the user know calibration has begun

for i in range(10):
    wlbt. Trigger()

    for num in range(ant):
        targets = wlbt.GetSignal((pair[num]))
        background.append(targets[0])

background = np.asarray(background)

for i in range(ant):
    summation.append(background[i] + background[i+ant] + background[i+(ant*2)] + background[i+(ant*3)] + background[i+(ant*4)] +
                    background[i+(ant*5)] + background[i+(ant*6)] + background[i+(ant*7)] + background[i+(ant*8)] + background[i+(ant*9)]) 

summation = np.asarray(summation)
average_background = summation/10


print("Calibration Complete")

# ________________________________________________________________________________________________________
#|                                           RAW SIGNALS' COLLECTION                                      |
#| _______________________________________________________________________________________________________|

# Using a 'try-and-except' here to allow user to stop the data collection whenever they want
# by using Ctrl+C
try:
    j=1 # Counter variable for saving the figure

    # The infinite loop that runs until the user stops the program with keyboard interrupt.
    # This loop allows the Wlaabot to continuously scan the the arena that has been set.
    while True: 

        # Walabot API function used to initiate the scan 
        wlbt.Trigger()
    
        # The elements in the previously declared 'signal_list' are cleared. This is done so that 
        # every time this loop runs, the 'signal_list' is updated with the new values and doesn't
        # carry on the previous values. Having the previous values in the list would disrupt the 
        # plotting because the size of the 'signal_list' wouldn't match the 'timeAxis' in that case.
        del signal_list[0:ant]


        # The for loop goes up to the number of antenna pairs used. This loop allows the Walabot
        # to get the raw signals from each one of the selected number of antenna pairs, for every 
        # scan. 
            # 'GetSignal' from WalabotAPI which returns the time domain values and the returned signal
            # amplitudes. The data from this function is stored in 'targets' (2D array). The first array 
            # within 'targets' has the returned signal amplitudes and thus, those values are appended to 
            # 'signal_list'. The second array in 'targets' contains the time domain values and thus, is 
            # assigned to the 'timeAxis'
        for num in range(ant):
            targets = wlbt.GetSignal((pair[num]))
            signal_list.append(targets[0])
            timeAxis = targets[1]


   		# background frame subtracted  
        new_signal_list = signal_list-average_background

        # Loop for writing the collected data to a csv file. 
        for i in range(len(new_signal_list[0])):
            for k in range(ant):
                f.write(str(new_signal_list[k][i])+',')
            f.write('\n')
     
        # The builtin function which updates the figure, with the plots from the previously defined
        # function
        drawnow(makeFig)

        # Saves the graphs from each scan of the Walabot (optional)
        # plt.savefig("frame"+str(j)+".png")

        print(j)

        j+=1


except KeyboardInterrupt:
    pass


wlbt.Stop()  # stops Walabot when finished scanning
wlbt.Disconnect()  # stops communication with Walabot

Heatmap.py

Python
# ---------------------------------------------HEATMAP-------------------------------------------
# |   File: Heatmap                                                                              |
# |   Type: .py (python)                                                                         |      
# |   Purpose: Reads data from 'raw_data.csv' and 'TOF.csv' to plot ellipse-based heatmaps for   | 
# |   signal intensity at different locations, relative to Walabot.                              |
# ------------------------------------------------------------------------------------------------

import matplotlib.pyplot as plt
import numpy as np
import pandas as pd


# _______________________________________________________________________________________________________
#|                                          REQUIRED PARAMETERS                                          |
#| ______________________________________________________________________________________________________|

# The user is prompted to enter the following parameters so that the program can identify which data frame
# and antenna pair to use, along with the range for the heatmap. Note that the range here is set by number 
# of points, NOT by the distance from Walabot. 
frameNumber =  int((input("Enter frame number: ")))
antennaPairInput = int(input("Specify antenna pair: "))
upperlimit = int(input("Enter the upper limit range (number of points): "))
lowerlimit = int(input("Enter the lower limit range (number of points): "))


# Based on user input, the starting value of range for reading rows from 'raw_data.csv' is calculated
# Since python indexing is zero-based, the user input needs to be subtracted by 1 
rowStartRange = (((frameNumber - 1) * 8192) + 1)
rowEndRange = (rowStartRange) + 8191
antennaPair = (antennaPairInput - 1)

# _______________________________________________________________________________________________________
#|                                            IMPORTING DATA                                             |
#| ______________________________________________________________________________________________________|

pd.set_option('precision', 18) # precision of values read from the csv file

# 'TOF.csv' is a one-column file and doesn't require a certain range of data to be read, hence, loadtxt
# from numpy library is used to import the data as a numpy array into 'roundtrip'. User needs to set 
# file path to 'TOF.csv' file
roundtrip = np.loadtxt(r'C:\Users\...\TOF.csv',dtype=float,delimiter=',',skiprows=42,usecols=(0,))


# 'raw_data.csv' is a large file (size varies depending on how much data is collected), so instead of 
# importing all the data from it, only a certain column (based on user specified antenna pair) from a 
# frame (also user input based) is imported into the variable 'power'. The absolute values of the signals
# is taken 
io = pd.read_csv('raw_data.csv', sep=",", header=None)
power = abs(io.ix[(rowStartRange + 40):rowEndRange,antennaPair].as_matrix())


# NOTE: The first 40 values from each frame are disregarded because they correspond to a distance (~5cm)  that  
# Walabot cannot detect with its long-range sensing profile. 
 

# _______________________________________________________________________________________________________
#|                                        PLOTTING ELLIPSES' HEATMAP                                     |
#| ______________________________________________________________________________________________________|


# Based on the upper and lower range limits, the max and min of the obtained signals is determined. These
# values are used to set the max and min intensity values for the heatmap
z_min = min(power[lowerlimit:upperlimit-1])
z_max = max(power[lowerlimit:upperlimit-1])


# 'theta' is used to convert the points on an ellipse into cartesian coordinates. Only one half of the ellipse
# is considered because the field-of-interest is in front of Walabot
theta = np.linspace(0,np.pi,225)


# Initializing empty numpy arrays, which will be updated in the for loop
majoraxisradius = np.empty(upperlimit)
minoraxisradius = np.empty(upperlimit)

# for loop used to make plot every ellipse in cartesian coordinates
for i in range(lowerlimit, upperlimit,10):

	majoraxisradius[i] = (roundtrip[i])/2
	minoraxisradius[i] = (np.sqrt((roundtrip[i])**2 - (0.0735**2)))/2 

	x = majoraxisradius[i] * np.cos(theta) 
	# 225 points for horizontal axis, for EACH ellipse 

	y = minoraxisradius[i] * np.sin(theta) 
	# 225 corresponding points for vertical axis, for EACH ellipse 

	z = np.full(225, power[i])
	# Setting the signal intensity value for the 'x' and 'y'  

	x1 = x.reshape(15,15)
	y1 = y.reshape(15,15)
	z1 = z.reshape(15,15)

	plt.pcolor(x1,y1,z1, cmap='jet', vmin=z_min, vmax=z_max) 
	# function in matplotlib for plotiing heatmaps

plt.colorbar() # adds the colorbar on the side of the heatmap
plt.show() # shows the colorbar

Credits

Fezza Haider

Fezza Haider

2 projects • 5 followers
Engineering Student, University of Waterloo
George Shaker

George Shaker

0 projects • 2 followers
Adj. Assistant Prof. @ University of Waterloo, ON, Canada

Comments