Our group decided to study how the foot traffic pattern of students in a specific hallway of our school would change if students knew they were being monitored in some way. We thought that a student might choose a different route to get to class to avoid being "watched". We thought this experiment would be interesting to observe because it could be applied to the real world, as people do try to avoid things that infringe upon their privacy. We planned to make it seem as though we were doing serious monitoring when we really were just simply measuring foot traffic with a laser tripwire.
In order to see the differences in foot traffic, our group needed 2 sets of data: foot traffic when students do not know they are being monitored and foot traffic when students do know they are being monitored. We also decided to have 2 different enclosures, the first being made out of wood to be inconspicuous and the other made of clear acrylic with designs on the outside to draw more attention to the experiment. We also produced flyers that stated that hallway activity would be "monitored". We began our prototyping with creating cardboard enclosures to ensure that our idea would work.
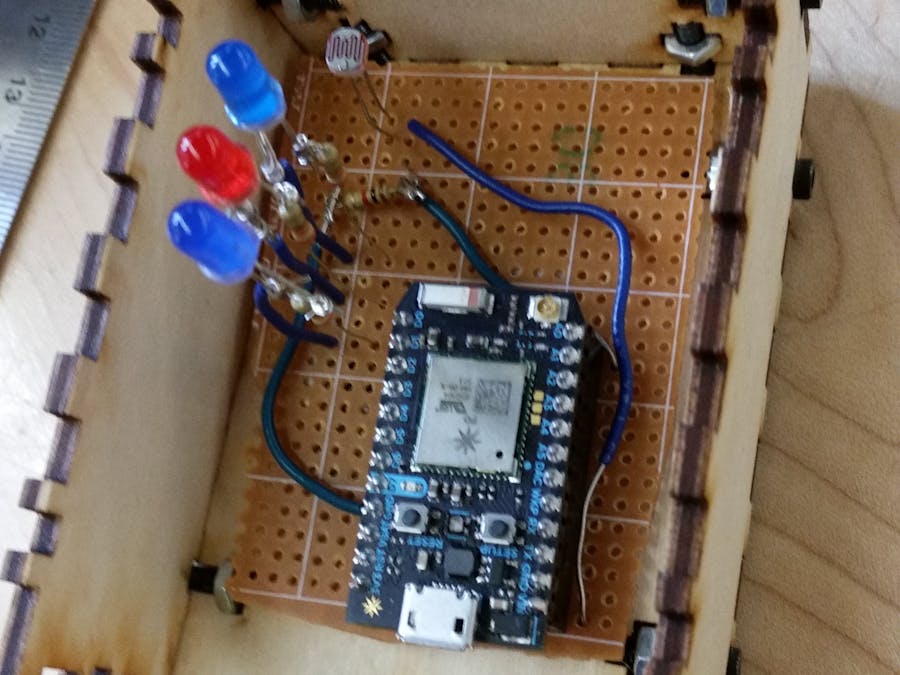
Our team divided the work suited to our strengths, but we all contributed to each other's work. Even with this great teamwork, we encountered a few problems. Our largest challenge was that our nodes would shift slightly while attached to the walls, which would shift the laser from hitting the light resistor. This is a huge problem because if the photocell is not being hit by the laser, it is supposed to mean that someone is passing through the tripwire, so our photon pushes to our data sheet that someone had passed through. Our data sheet flooded with false triggers and we would be forced to delete all the data, realign the nodes, and start again. occurred a few times, and we were forced to keep trying new ways to completely secure our nodes, along with new positions for them.
Our group worked very well together and would say we learned a great deal also. When a member was stuck with a task, others helped him out and they worked together to overcome it. We also learned from having to realign the laser diode and photocell countless times that even the smallest factors can ruin your data. If either node was nudged over accidentally then the tripwire would stay being activated until we came to move it back. This simple act would send hundreds of incorrect data points to our sheet, which was a large problem we were able to overcome.
When it came to working with our data, our group found it incredibly difficult to sift through the 82,000 data points, as did the programs we tried to use. We were able to create simple looking graphics to display our data, but when we started to try to comb through the outliers with filters, the program would crash. As seen in the labeled graph, the bad data accounts for a large portion of our data.
We did manually sift through the data, but even with the bad data removed, our results would be inconclusive. We ended up with collecting data consistently for only 5 days, and the problem is that in the second phase, when the nodes are supposed to be noticed, we had a day off of school. Missing just one day may not seem like much, but when the one day is 20% of the project, that is a large chunk of data to be missing. Also, with our data having large chunks of unusable points scattered within it, comparing between the two phases becomes near impossible.
In conclusion, we are unable to answer whether less students crossed through the hallway when they felt they were being monitored by our nodes. Our group needed consistent data in order to provide a reliable answer. We encountered many problems throughout the project that kept us from being able to get consistently useable data.
1 / 10 • Our flyer to "warn" students about being monitered


Comments