


Hardware components | ||||||
 |
| × | 1 | |||
| × | 1 | ||||
| × | 1 | ||||
Software apps and online services | ||||||
| ||||||
sylwekkominek/SpectrumAnalyzer was created because, since childhood, I liked watching the "jumping bars" moving in sync with music on my Technics EC-EH550 stereo system. Unfortunately, modern audio equipment with built-in spectrum analyzers is no longer available. There are many visualizer apps online, but they usually have limitations: they offer only a few adjustable parameters, which quickly become boring, or they rely on microphone input — which is not ideal because it picks up ambient noise, room echo, and the microphone changes the frequency response. SpectrumAnalyzer in its basic version works well with a microphone, but it is also easy to run on a Raspberry Pi, where you can capture audio samples from an optical input. I use a HiFiBerry DAC + DSP board for this purpose. One of the strengths of the application is its flexibility — users can freely modify colors and frequency bands. The app has great potential for experimentation and educational purposes. It helps new users easily get familiar with digital signal processing (DSP) and graphics programming.
The core of this project is the AudioSpectrumAnalyzer class, which manages the entire process using several parallel threads for real-time performance:
samplesUpdater – collects audio data using PortAudio (or a custom signal from audioConfig.py) and places it into a queue.
fftCalculator – applies a window function and computes the FFT using the FFTW library. It uses Welch’s method with overlapping to increase the number of frames per second (FPS), which is crucial for smooth animation.
processing – processes FFT data, applies gain correction, peak hold, averaging and smoothing.
drafter – converts dBFS levels into vertex offsets sent to the GPU to render the bars.
flowController – monitors the current FPS and dynamically adjusts the amount of overlapping used in Welch’s method. This adaptive algorithm automatically increases or decreases overlap depending on hardware performance and the desired FPS set in config.py.
Full documentation: https://sylwekkominek.github.io/SpectrumAnalyzer/The app is also available for Windows in the Microsoft Store and can be downloaded for free: https://apps.microsoft.com/detail/9ngnl3tjj7bg?hl=en-US&gl=USPreparing the software environment:
sudo apt update && sudo apt install -y g++ cmake python3 python3-dev libglfw3-dev portaudio19-dev libfftw3-dev pkg-config git
git clone https://github.com/sylwekkominek/SpectrumAnalyzer.git
Compilation and running:
cd SpectrumAnalyzer && mkdir build && cd build && cmake .. && make -j4
(This step is only required for Raspberry Pi users: export MESA_GL_VERSION_OVERRIDE=4.5)
./spectrum-analyzer
Do not forget to configure your input audio device.
By default, the application runs in fullscreen mode with a resolution of 1920x1080 (Full HD). You can change this resolution and refresh rate by editing the config.py file.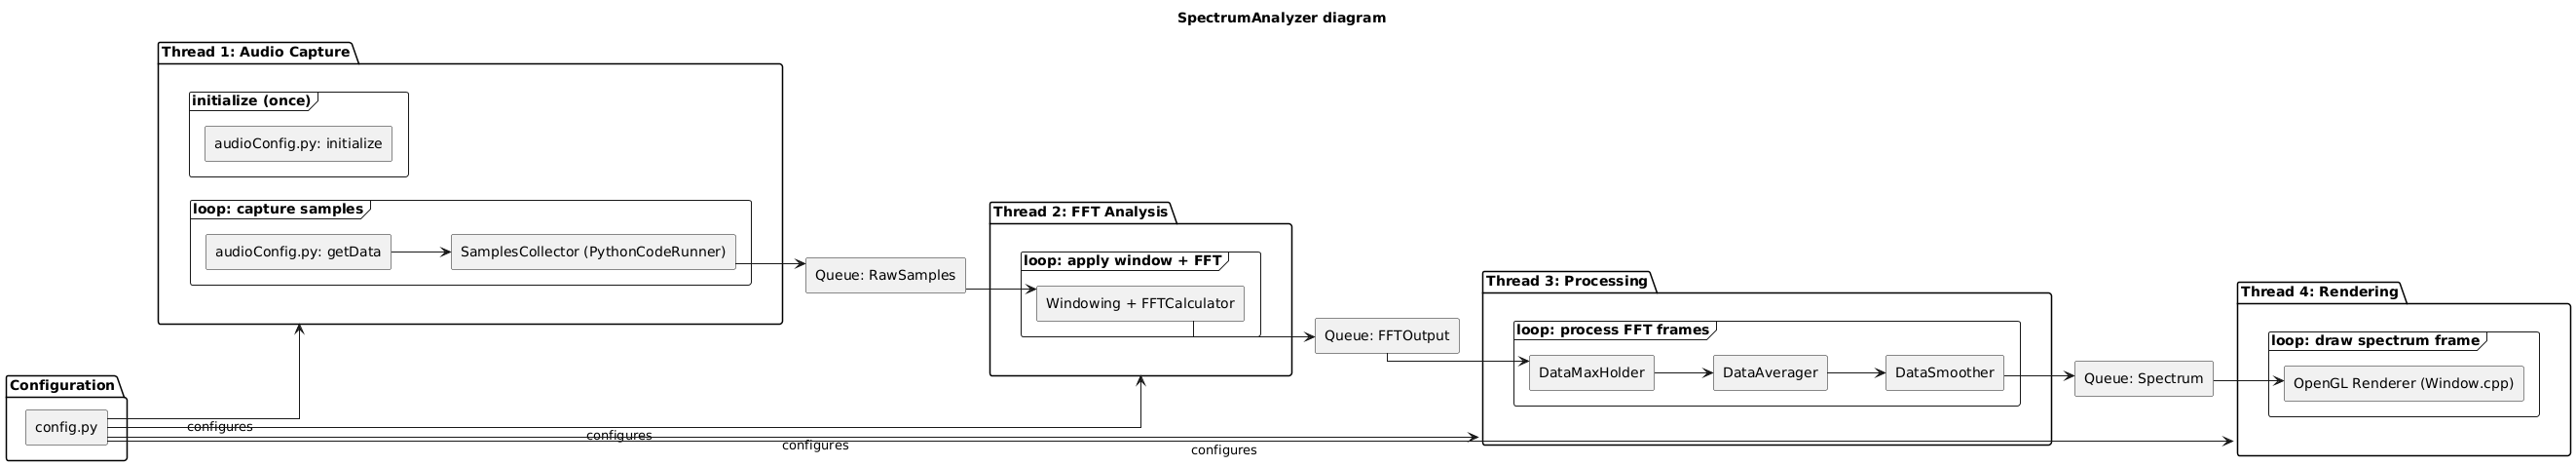


Comments