

Hardware components | ||||||
 |
| × | 1 | |||
 |
| × | 1 | |||
Software apps and online services | ||||||
| ||||||
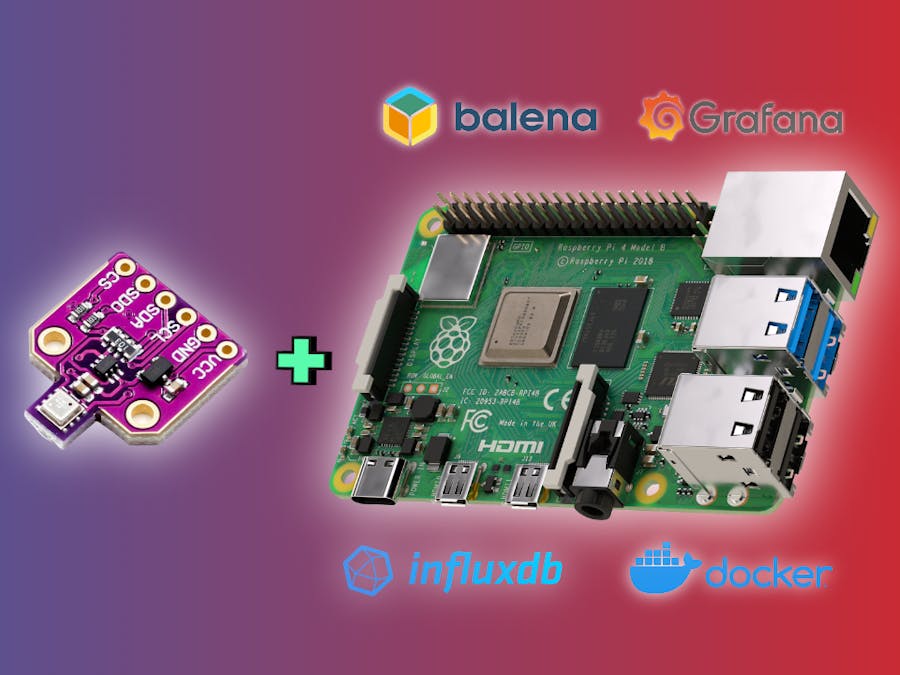
In this tutorial, we will connect a BME680 sensor to your Raspberry PI board. We will build an IoT system that monitors BME680 sensor readings by using open source tools such as Docker, InfluxDB, BalenaOS and Grafana. In other words, we will show how to build a a comprehensive environment monitoring dashboard solution from scratch based on Grafana that visualizes the data acquired from BME680 sensor.
Brief overviewThe Raspberry Pi acts as a central server that runs the following components:
- balenaOS is a minimal Linux-based OS which mainly packages balenaEngine, an engine designed to run Docker-like containers. BalenaCloud allows us to push applications to the Raspberry Pi and other devices fully remotely and over the air. Their cloud platform is free for up to 10 devices and lets you push updates to applications running in containers on devices.
- Sensor is the python library and code for accessing the sensor, taking readings and saving them in the database.
- InfluxDB is a time-series database.
- Grafana is an open-source platform for data visualization. Grafana reads the data in InfluxDB and manages the dashboard to visualize such information.
A combination of these tools can provide you with outstanding monitoring and analysis abilities of your environment monitoring dashboard. There are many options to install both of these tools separately or together, but the most efficient is by using the Docker technology. It takes just a few minutes to spin up these tools together.
Hardware requiredThe components you will be required for this project are as follows:
- Raspberry Pi board
- CJMCU-680 module
- A 16GB or more microSD card.
- Power Adapter for Raspberry Pi.
- A laptop or desktop computer for flashing BalenaOS image on the SD card.
You’ll need:
- A tool to flash your SD card, such as balenaEtcher
The CJMCU-680 module is based on the BME680 sensor from Bosch. It allows you to measure environmental parameters such as gas content in the air, as well as pressure, humidity and air temperature.
It also allows you to detect volatile organic compounds (VOC) in the air, so it can be used to monitor gases and alcohols, such as ethyl alcohol, carbon monoxide and perform air quality measurements. At the same time, the sensor cannot measure the content of a specific gas or alcohol, since it gives the value of the total content of VOC compounds in the air.
BME680 has I2C and SPI interfaces for working with the microcontrollers.
There are 6 pins on the module:
- Vcc - Voltage input pin
- GND - Ground pin
- SCL - SPI Clock pin
- SDO - Serial Data Out pin
- SDA - Serial Data In pin
- CS - Chip Select Pin for SPI communication
The BME680 sensor communicates with the Raspberry Pi over a bus called I2C which is a serial communication bus that requires 2 wires. These two communication wires are referred to as serial clock (SCL) and serial data (SDA). In addition to the two communication wires, we also need to provide the sensor with power (3.3V) and ground.
The 40 pin GPIO header is standard across the Pi 2 and later. You will need to connect 4 pins with the Raspberry PI Board:
- SDA ==> pin 3
- SCL ==> pin 5
- Vcc ==> pin 1
- GND ==> pin 9
Here's the my Raspberry PI 4 Board connected with BME680 sensor:
This section can be skipped. However, if you want to understand the basic python code to retrieve data from the BME680 sensor, you can proceed with it.
Make sure you have the latest version of the Raspbian operating system You can download the latest version from the official Raspberry website. I’ve already published a quick start guide recently. Check it out.
After installing the OS, we will check whether the latest drivers are installed with the following commands.
sudo apt-get updateThis command updates the list of available packages and their versions.
sudo apt-get upgradeI2C Tools is a package with useful console tools for I2C. After installation, several useful utilities will be available to us: i2cdetect, i2cdump, i2cget and i2cset.
sudo apt-get install i2c-toolsTo find a list of the devices connected to the I2C bus on the Raspberry Pi you can use the following command:
sudo i2cdetect -y 1Here is the output :
0 1 2 3 4 5 6 7 8 9 a b c d e f
00: -- -- -- -- -- -- -- -- -- -- -- -- --
10: -- -- -- -- -- -- -- -- -- -- -- -- -- -- -- --
20: -- -- -- -- -- -- -- -- -- -- -- -- -- -- -- --
30: -- -- -- -- -- -- -- -- -- -- -- -- -- -- -- --
40: -- -- -- -- -- -- -- -- -- -- -- -- -- -- -- --
50: -- -- -- -- -- -- -- -- -- -- -- -- -- -- -- --
60: -- -- -- -- -- -- -- -- -- -- -- -- -- -- -- --
70: -- -- -- -- -- -- 76 --
# BME680 I2C addresses
I2C_ADDR_PRIMARY = 0x76
I2C_ADDR_SECONDARY = 0x77
Now, let's install Adafruit BME680 Library. Enter the below command on terminal:
sudo pip3 install bme680Let’s try out the sensor with a simple Python code that will give us the ambient temperature in degree Celcius, the atmospheric pressure in hPa and the relative humidity.
Create a new python file
nano bme680_sensor.pyPaste on bme680_sensor.py below code snippet:
import bme680
import time
import datetime
from datetime import datetime

try:
    sensor = bme680.BME680(bme680.I2C_ADDR_PRIMARY)
except IOError:
    sensor = bme680.BME680(bme680.I2C_ADDR_SECONDARY)

sensor.set_humidity_oversample(bme680.OS_2X)
sensor.set_pressure_oversample(bme680.OS_4X)
sensor.set_temperature_oversample(bme680.OS_8X)
sensor.set_filter(bme680.FILTER_SIZE_3)

try:
    while True:
        if sensor.get_sensor_data():
            output = datetime.now().strftime('%Y-%m-%d,%H:%M:%S,')+'{0:.2f} C,{1:.2f} hPa,{2:.3f} %RH'.format(
                sensor.data.temperature,
                sensor.data.pressure,
                sensor.data.humidity)
            print(output)
        time.sleep(1)
except KeyboardInterrupt:
    pass
Type the following command in the terminal
sudo python3 bme680_sensor.pyIn my case, command gives following output to screen :
2019-12-28,07:31:39,21.94 C,1000.17 hPa,37.929 %RH
2019-12-28,07:31:40,21.94 C,1000.17 hPa,37.941 %RH
2019-12-28,07:31:41,21.94 C,1000.18 hPa,37.924 %RH
2019-12-28,07:31:42,21.95 C,1000.18 hPa,37.929 %RH
2019-12-28,07:31:43,21.95 C,1000.18 hPa,37.924 %RH
2019-12-28,07:31:44,21.95 C,1000.18 hPa,37.917 %RH
2019-12-28,07:31:45,21.95 C,1000.18 hPa,37.924 %RH
2019-12-28,07:31:46,21.96 C,1000.17 hPa,37.914 %RH
2019-12-28,07:31:47,21.96 C,1000.18 hPa,37.914 %RH
2019-12-28,07:31:48,21.96 C,1000.21 hPa,37.909 %RH
2019-12-28,07:31:49,21.96 C,1000.20 hPa,37.903 %RH
2019-12-28,07:31:50,21.97 C,1000.20 hPa,37.897 %RH
2019-12-28,07:31:52,21.97 C,1000.19 hPa,37.886 %RH
2019-12-28,07:31:53,21.97 C,1000.19 hPa,37.897 %RH
2019-12-28,07:31:54,21.98 C,1000.18 hPa,37.893 %RH
2019-12-28,07:31:55,21.98 C,1000.18 hPa,37.888 %RH
2019-12-28,07:31:56,21.98 C,1000.20 hPa,37.893 %RH
2019-12-28,07:31:57,21.98 C,1000.20 hPa,37.888 %RH
2019-12-28,07:31:58,21.99 C,1000.20 hPa,37.888 %RH
2019-12-28,07:31:59,21.99 C,1000.19 hPa,37.865 %RH
2019-12-28,07:32:00,21.99 C,1000.18 hPa,37.876 %RH
2019-12-28,07:32:01,22.00 C,1000.17 hPa,37.870 %RH
2019-12-28,07:32:02,22.00 C,1000.20 hPa,37.853 %RH
2019-12-28,07:32:03,22.00 C,1000.19 hPa,37.870 %RH
2019-12-28,07:32:04,22.00 C,1000.19 hPa,37.864 %RH
2019-12-28,07:32:05,22.00 C,1000.19 hPa,37.859 %RH
2019-12-28,07:32:06,22.01 C,1000.19 hPa,37.853 %RH
2019-12-28,07:32:07,22.01 C,1000.19 hPa,37.846 %RH
2019-12-28,07:32:08,22.01 C,1000.18 hPa,37.846 %RH
2019-12-28,07:32:09,22.01 C,1000.18 hPa,37.840 %RH
You should start seeing temperature, pressure and humidity values popping up on the screen every second. Press Ctrl + C to quit the program.
So let’s get started.
Step 1: Create a free balenaCloud accountThe first thing you’ll need to do is sign up for an account at Balena.io. It's completely free for your first ten devices with no functionality restrictions or credit card required.
- Browse to https://www.balena.io
- Click on Signup
- When you are done with signup, you should end up on your balenaCloud dashboard here.
To create an application, do the following:
- On main dashboard of balenaCloud click on Create application button as shown bellow:
- For this tutorial, you can name the application Weather.
- Make sure to select the correct device type. In my case it was Raspberry Pi 4. This becomes important when downloading the balenaOS image to flash.
- Free application type is Starter - so for this tutorial, select that.
- Click Create new Application button
Next you will be asked to add a device.
- Click Add device
- For Select Device Type - leave the default (Raspberry Pi 4 in my case)
- For Select BalenaOS Version - leave the selected default - usually the most recent and stable version
- For Select Edition lets keep things simple and select Production. When you're getting started, a Development image is the most useful, as it permits many testing and troubleshooting features.
- For Network Connection make sure to toggle to Wifi+Ethernet. Change the YOUR-SSID-NAME and the YOUR-NETWORK-PASSWORD with your Wifi Internet information.
- If you click Advanced you can see that the default is to check for an update only every 10 minutes. You can’t set it any lower than that (at least for the free version).
Once you have finished your image configuration, click the Download balenaOS button. When the download completes, you should have a zipped image file.
Step 4: Burn the image- Put a microSD card that you can write over into your computer or laptop.
- Install Etcher. Etcher is known as balenaEtcher and you can download the latest version from here
- Flash your zipped image file to a microSD card using Etcher
- Browse to your balenaCloud dashboard
- Put the microSD card into your Pi
- Plug in your Raspberry Pi and watch your dashboard
- It should automatically connect to your WiFi network and you should see it appear online on your balenaCloud dashboard.
The recommended way to deploy code is to install the balena CLI. The balena CLI (Command-Line Interface) allows you to interact with the balenaCloud and the balena API through a terminal window on Linux, macOS or Windows.
- Download the latest installer from the releases page based on the version of your OS.
- Install it.
- After the installation completes, open terminal and check that the installation was successful by running the following commands on a command terminal:
balena version- It should print the installed CLI version.
11.28.13You may also install the balenaCLI via npm on a system running NodeJS, as explained in NPM Installation.
Step 7: Login to your balena account using CLI- When you have the CLI installed and working, the first step is to login to balenaCloud by issuing the below command:
balena login- You will be asked how you wish to authenticate:
_ _
| |__  __ _ | | ____ _ __ __ _
| '_ \ / _` || | / __ \| '_ \ / _` |
| |_) | (_) || || ___/| | | || (_) |
|_.__/ \__,_||_| \____/|_| |_| \__,_|
Logging in to balena-cloud.com
? How would you like to login? (Use arrow keys)
❯ Web authorization (recommended)
Credentials
Authentication token
I don't have a balena account!- Select Web authorization(recommended)
- Click on Authorize on the dashboard
- See a page saying authorization has been granted with a button to go to the dashboard
The next step is to download the code for the balenaSense project from GitHub. It is a project to monitor air quality with a Raspberry Pi, Grafana and InfluxDB.
Open up a terminal window and in a projects folder run this command:
git clone https://github.com/balenalabs/balena-sense.gitChange into the project directory:
cd balena-senseNow that your Raspberry Pi has been provisioned, has booted, and connected to balenaCloud, you're ready to push the application code to the device.
Since you have the CLI set up and the latest code downloaded, you can now execute a single command to push that code to balenaCloud which in turn builds the Docker image and handles the process of setting it up and running it on your device.
Ensure you are in the root of the project directory before issuing this command:
balena push WeatherIf all went well you’ll see the balena unicorn mascot and the code you’ve just pushed will automatically be distributed to the devices in your application.
You can see the progress of the device code updates on the device dashboard:
- When it is done it should say Online.
- If everything worked out correctly, after a few minutes your device information screen in the dashboard should look something like this, showing the services running, one for each of the software components and and see some logs on your dashboard..
That’s basically it! From this moment you have these Grafana, InfluxDB, Sensor containers running locally on your Raspberry Pi board.
Step 10: Creating the Dashboard Using GrafanaAs long as your balenaSense device is online and working, The last step is creating the dashboard using Grafana. You’ll be able to access your dashboard by ip address, which can be find inside of your device information screen in the dashboard.
- To access my device, in my case I would use http://192.168.8.102
One of the great benefits of using a free balenaCloud account is that you’re able to use the Public Device URL feature. If you drill down in the dashboard for a device, you will see that there is an option to enable a public URL. That means that your Raspberry Pi can be accessed from anywhere in the world.
An example of Grafana Dashboard is shown below:
If you'd like to log in to Grafana and start playing with the settings, the default credentials are admin and admin.
Congratulations!! At the end of this post, you hopefully know how to build an Environment Monitoring Dashboard with Raspberry Pi board and BME680 sensor by yourself.
ConclusionIn this post, we’ve worked on setting up a Raspberry Pi device to communicate with BME680 sensor hosted on BalenaOS. Monitoring with InfluxDB and Grafana can provide an easy solution to monitor your IoT devices.
Thanks for taking the time to check out this guide. Let me know in the comments section below if some of the steps seem unclear.


Comments