

Hardware components | ||||||
 |
| × | 50 | |||
_ztBMuBhMHo.jpg?auto=compress%2Cformat&w=48&h=48&fit=fill&bg=ffffff) |
| × | 1 | |||
Software apps and online services | ||||||
 |
| |||||
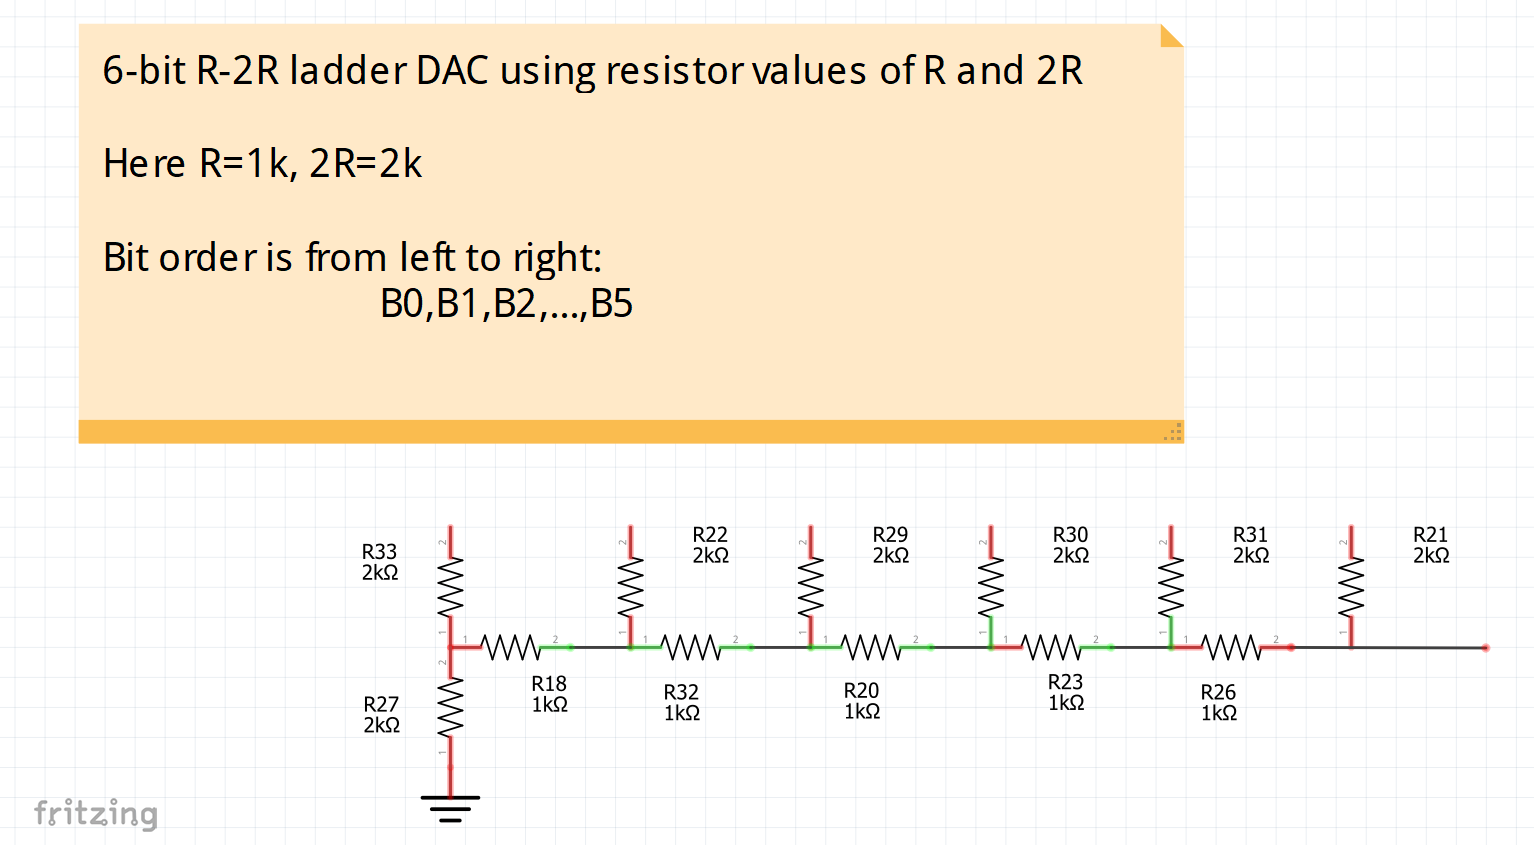
One of the simplest implementations of a digital to analog converter can be achieved by designing a R-2R ladder DAC. This type of DAC only needs resistors to work making it a very beginner-friendly DAC.
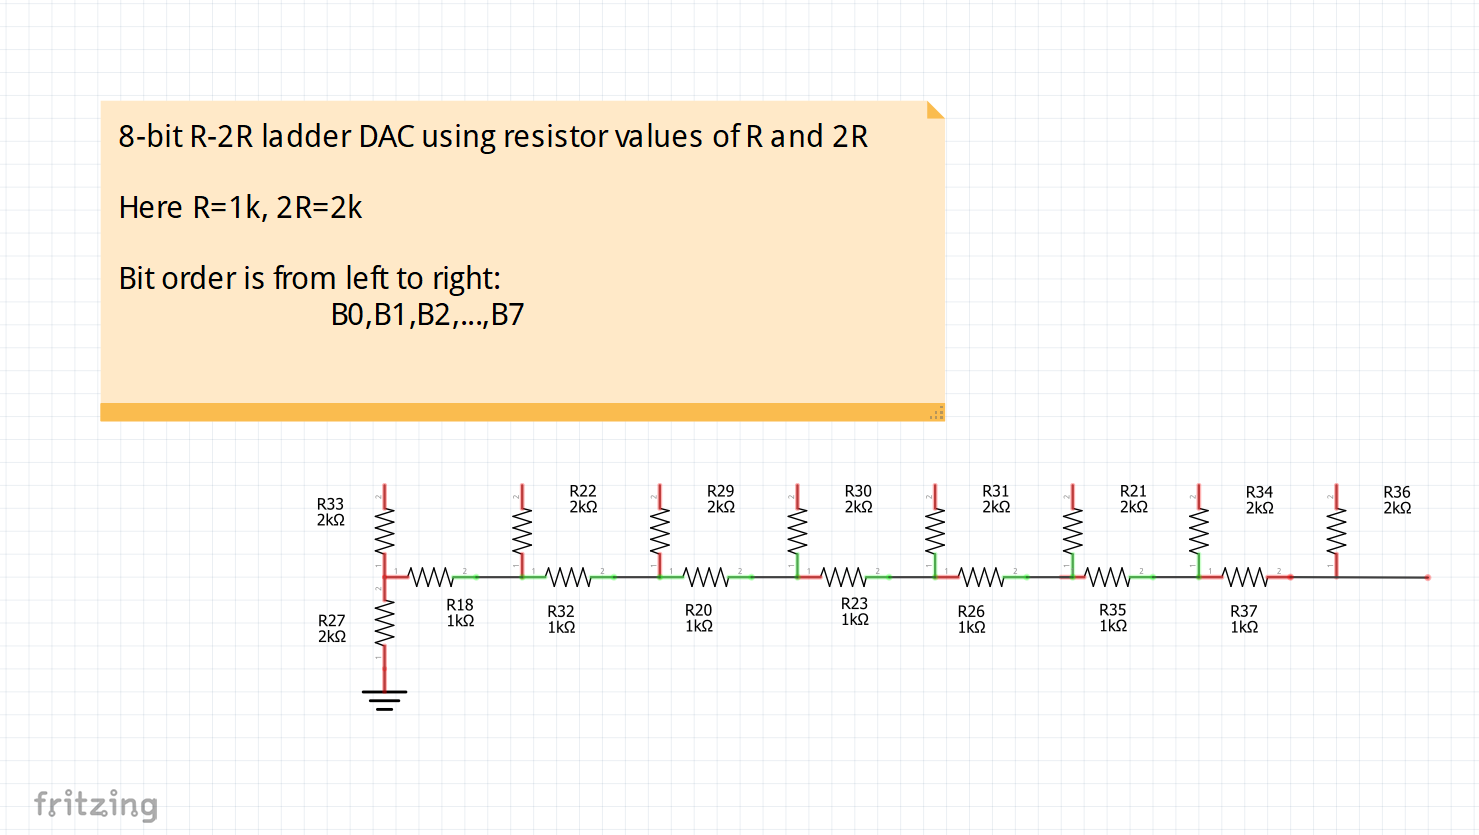
The basic principle of this type of DAC is that you just need two values for resistors. R and 2R. Then you can set them up as shown in the schematic below.
R can be anything as long as each occurrence of R in the schematic is the same value.
For example, if we choose R = 1k, then 2R would just be two times the amount. In this case 2R = 2k. So you could use just 1k and 2k resistors.
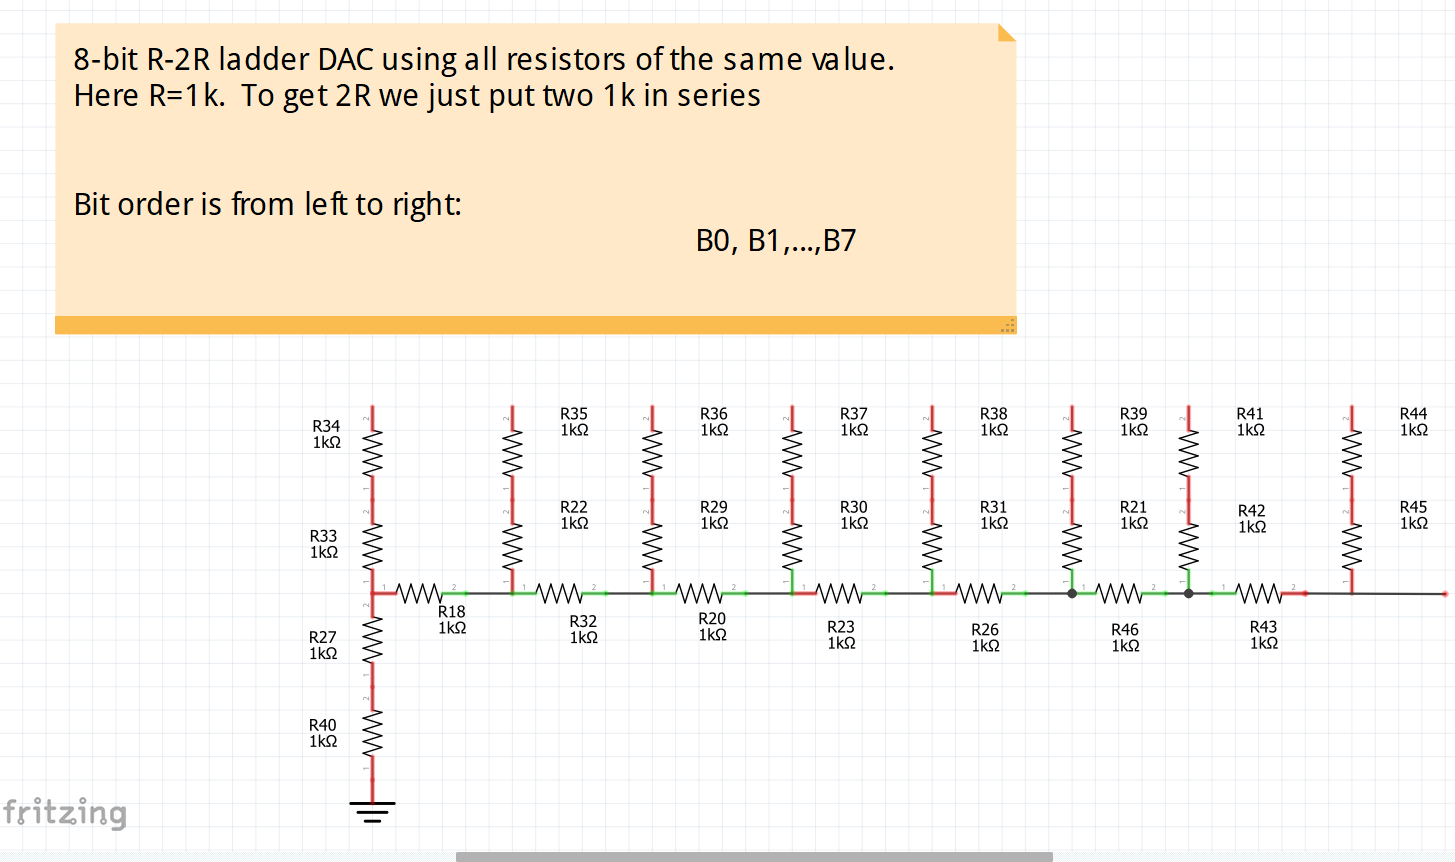
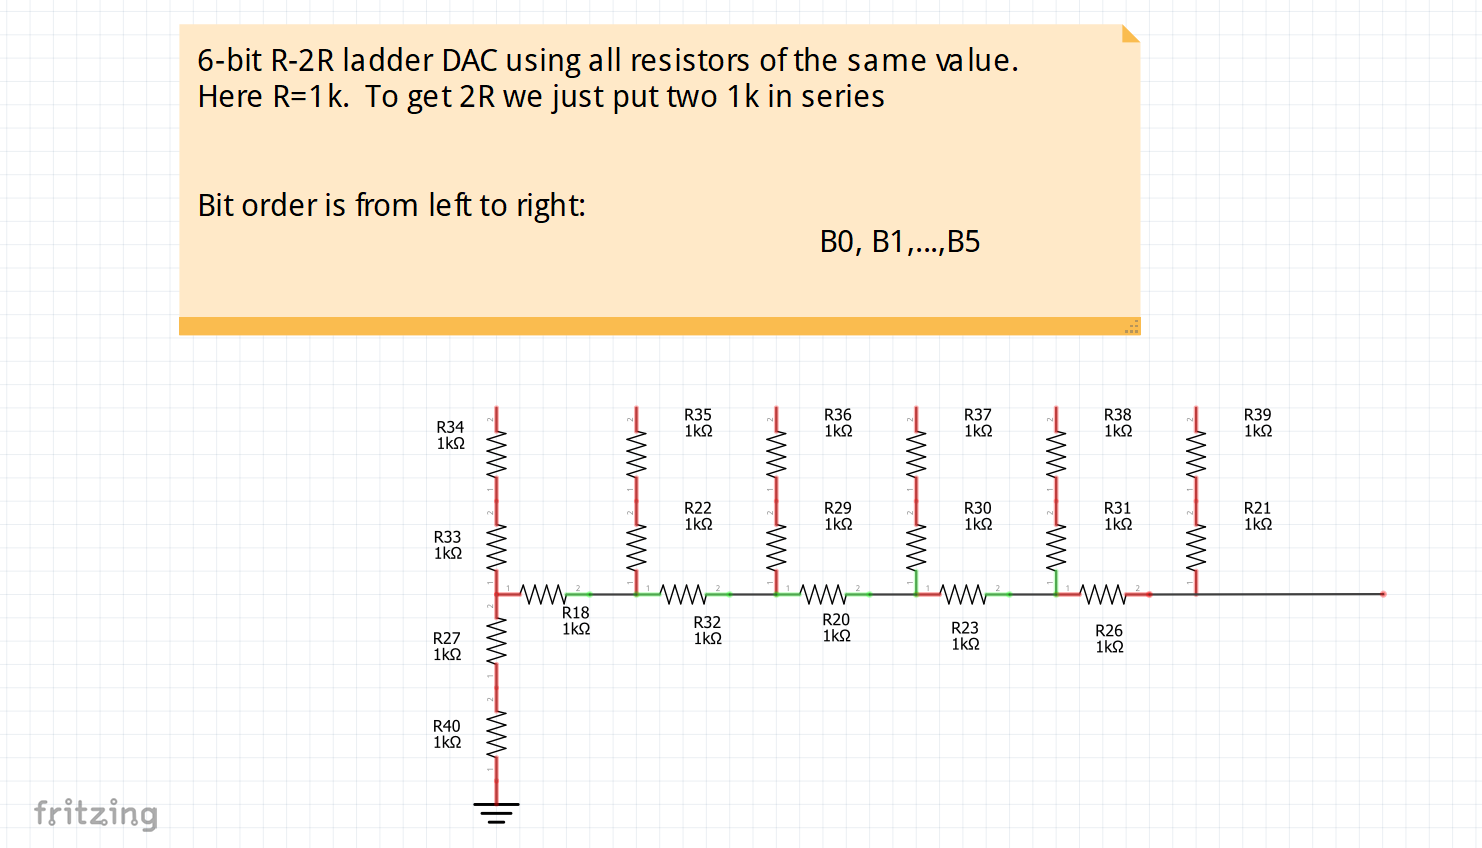
If you used R=3.3K then 2R = 6.6k and so on. If you just want to use the same value of resistors for everything, then to get 2R, you would just need to put them two resistors in series and that would increase your component count.
The number of bits are determined by how many branches of 2R you have sticking out. In this project we will be using an 8-bit R-2R and a 6-bit R-2R for the Arduino Uno or Nano. If you are using another microcontroller that you know supports a full port manipulation of at least 8-bits such as the STM32 "blue pill" and "black pill", then you can just use two 8-bit DACs.
Side remark on DAC ICs:
This project is focused on using a R-2R DAC, but you can feel free to use a DAC IC to achieve something similar. If you're going to be using a DAC IC, I recommend using one that supports a fast communication protocol such as SPI since I2C will be too slow to draw a detailed image. I will not cover how to use a DAC IC in this post but maybe in a future one. The R-2R still my preferred method as it can output images with more detail.
Port manipulationWe will be using parallel port manipulation of our microcontroller. The reason for doing so is because it allows for a faster output speed and also keeps code simple. You can read more details on the port registers for Arduino in this link.
The Arduino Uno and Nano have the ATmega328p microcontroller. This microcontroller shares the same pin mapping with the Atmega168:
The port pins and bits are denoted by their label PXN where X is the port letter and N is the bit number.
Example: PB1 is for PORT B bit 1. Similarly PC5 is for PORT C bit 5.
If we inspect the pins, we see that the microcontroller has ports B, C, and D. By going back to the Arduino reference we can see which ports can be written or read from or both. In our application, we only care about write.
The documentation states that PORTD is read/write and it is mapped to digital pins 0 to 7. This gives us full 8-bits of the ports to write to.
Next we have PORTB which as stated are mapped to digital pins 8-13. An additional statement is made saying that 6&7 which would complete the full 8-bits are not accessible. This port can only be used to write 6-bits.
The same is true for PORTC. It is mapped to analog pins 0-5 but two pins are also reserved giving us only 6-bits to write.
Because of these restrictions, we will have to use a combination of an 8-bit DAC for PORTD and a 6-bit DAC for either PORTC or PORTB.
We will be using PORTD and PORTB and now we can start wiring the DACs to the pins.
If you need some visual aid on how to assemble, this is how I assembled both the R-2Rs in the breadboard. Note that I used two R-2Rs since I was testing it on my STM32 "black pill." I put two jumper wires sticking out so I could connect my oscilloscope probes to it and also a ground wire on the side. I used all 10k resistors so for my 2R I put two 10k resistors in series.
Here's a cleaner breadboard setup using Tinkercad. I marked the outputs with X and Y as those will be what our oscilloscope probes connected to. If you need more guidance on the setup, I will provide schematics showing the R-2R ladders made up of all with the same resistor values and another one with two values.
Make sure to check your grounds! Every time I assemble this setup I tend to forget. Also make double check you did not leave any gaps with no connections.
ArduinoCode
Now it's time for the Arduino sketch.
First we need to setup our ports to be outputs. From the Arduino reference on port manipulation. We can see how to set the ports:
Basically a value of 1 to the bit will set it as output and a value of 0 will set it as input. For PORTD we can write directly since all bits are accessible. For PORTB, remember that bits 6 and 7 are not usable since they map to the crystal. It is good practice to use bitwise OR with a value of 0 to avoid modifying bits that won't be set.
In our setup loop this will be the code:
The code will be attached for download, so don't worry about typing it by hand.
The for loop below the configurations simply remaps the values for the 6-bit port. These values will be from a list that will have values of 8-bit range. To remap to 6-bits, our max value will be 2^6-1 which is 63. We are mapping from a range of 0 to 2^8-1 which is 255. The reason we remap in the Arduino code is because our hand-plotter tool will output the x and y points in terms of 8-bits. We can change it in either code, but it's better to change it on the microcontroller used.
Basically we need some delay depending on the oscilloscope. I found that for mine 1 is fine. In fact, completely omitting the delay is also fine. For points, it will be automatically generated by our hand plotter tool so you can just copy and paste the number but basically this is how many points there are to plot so the iterating variable can go through them. Anyways, here's the full code:
The x_points and y_points arrays will be different for you each time you draw something and will be automatically generated with our tool.
Side remark on fast PWM:
If you are an advanceduser of microcontrollers, you might realize that if concerned about speed, then perhaps thesame can be achieved by fast PWM and modifying clock registers. Then feeding the PWM outputs to a low-pass filter to get an analog voltage which would reduce the pin count. I have tried both methods, and this still results in better support for images with more detail. At least in the Arduino Uno
Drawing ToolI made this tool in Python 3 using tkinter. If you don't have tkinter installed, install it with pip.
pip install tkThe code will just be attached, but basically it records the coordinate on the window where your cursor was clicked. Do not try to resize the window as it will change the resolution. If you want to be more precise, use the magnifying glass tool in Windows. The window is based on 255x255 since those will be the maximum values of our bit ranges. Of course one of the dimensions will be mapped to 6-bits if you're using an Arduino UNO.
To call the tool simply use this format
python drawlog.py > arduino_list.txtThis will create a.txt file named arduino_list.txt with the Arduino list for x_points, y_points and NUM_POINTS generated for you, ready to copy and paste into your code.
As an example, this is how it the.txt file looks when you open it. You just need to replace those lines in the code.
Here it how it looks like once it's opened. From there you can draw anything.
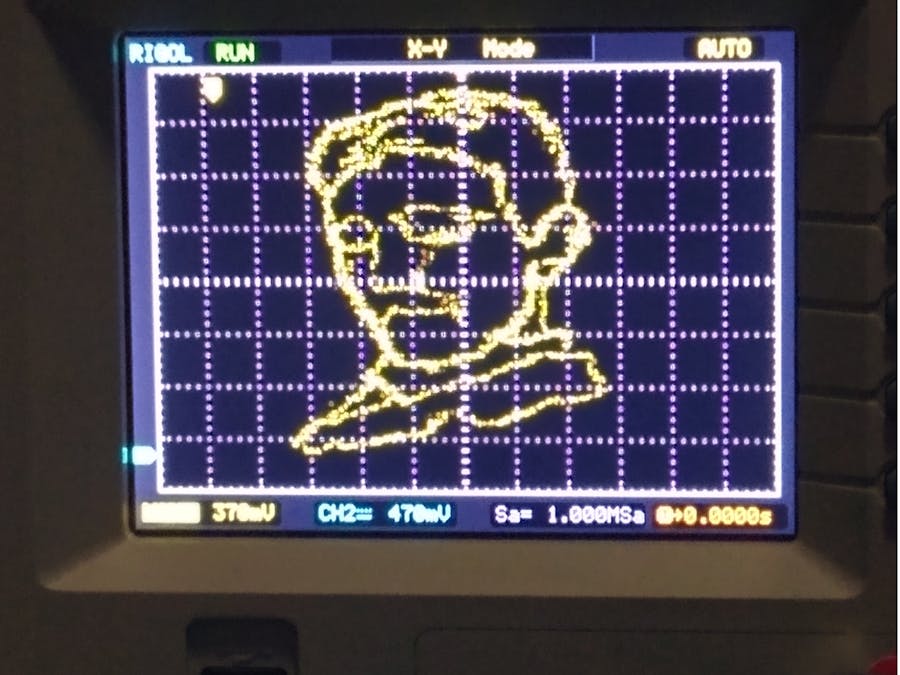
I drew the following picture to test it out. The code is generated upon closing of the window.
And after uploading the code on the Arduino this is how it looked like in X-Y mode.
IMPORTANT:
If you run to a compilation error talking about memory, this is due to the low memory available in the Arduino UNO. That means you should draw a less-detailed image. I think the maximum amount of points was about 400, but it might be more. If you use an STM32 "Blue pill" or "black pill" this number is upwards of 4, 000.
Oscilloscope X-Y modeThe oscilloscope must be set to x-y mode. 8-bit R-2R DAC output (PORTD) will be connected to Channel 1 and 6-bit R-2R DAC (PORTB) will be connected to Channel 2. From there you can adjust it with the knobs until you see an image.
That's it! If you have any questions feel free to ask. Additionally, if you want to try it out on a blue pill or black pill here's the link to my GitHub page with some sample code
Now here are some images I have plotted.
Edit:
Important Details for memory management
As Tim mentioned in the comments
- In your Arduino code your iterator over the points, t, is a "byte" type, so only supports up to 255 points. Why not make it an "int"?
- Your plotter code outputs "const unsigned long" for x_points and y_points - that won't work as you later modify y-points. Also, why not just use "byte" to save memory?
Be aware of the hardware limitations you are using. For the Arduino Uno it is better to use byte, however if you are using an STM32 or even ESP32, you will have more points avaialble to plot. Thank you all for your feedback.
Timster:
I've found a way to massively increase the number of points supported on an UNO - move them into program storage space. You can do this with the PROGMEM modifier. This way you can store around 15,000 points!
So declare the arrays like this:
const int NUM_POINTS = ...
const byte x_points[NUM_POINTS] PROGMEM = {...
const byte y_points[NUM_POINTS] PROGMEM = {...
Don't do the modification to the y_points in the setup function (i.e. remove the for loop there). Instead do a bit shift in loop function.
You also need a special command to read data from program memory (pgm_read_byte_near). So the for loop in the void loop() looks like:
for (int t=0; t < NUM_POINTS; t++) // run through points
   {
     PORTD = pgm_read_byte_near(x_points + t);
     PORTB = pgm_read_byte_near(y_points + t) >> 2;
     delayMicroseconds(FIGURE_DELAY);
   }
Then it's possible to store one high res image or multiple smaller images and cycle between them 😃


Comments