


On 18 April 2020, the Dutch government initiated a hackathon to develop solutions for the COVID-19 pandemic. This resulted that a small group of people united in the MAAK! collective, in order to participate. It was clear from the start that we would develop a tracing app based on symbiotic algorithms, an agent system that is able to learn patterns in a similar vein as a neural network (NN). The big difference with an NN is that the agent system learns these patterns 'on the job', and is very resilient to changes in its environment. When the hackathon was (more or less) cancelled, we decided to keep on developing our ideas for the COVID-19 challenge that was by then announced on Hackster.io.
For the COVID-19 challenge, the big advantage of this approach is that the network does not require personal data, because of the abstract nature of the communication between the agents in the network. This made the solution GDPR ready! In fact, after a few brainstorm sessions, we realised that we would not track (infected) persons, but concentrate on the traces people leave behind in their environment, which may signify a probability of infection. These traces are maintained on a server.
A simple example may demonstrate this approach.
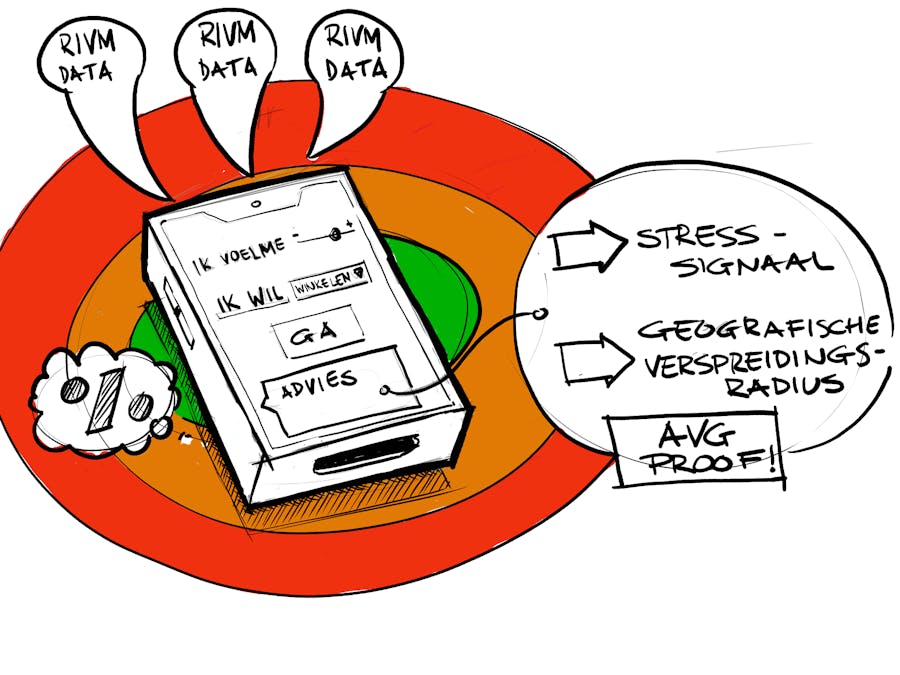
Suppose my mobile app keeps track of my whereabouts using GPS. One morning I wake up and do not feel very well, so I tell the app that I am feeling a bit ill. The app uses this information to consult with a server, and based on the locations, the app deducts that there is a possibility that its owner may have contracted COVID-19, or another disease that requires immediate medical attention. So it returns a message asking if an appointment with the doctor should be scheduled.
The user decides to do this, and after a few days the test is performed with a positive result. The doctor confirms to the server that the patient indeed is infected with COVID-19, after which the user receives a notification with a request to update the traces. When she agrees to this, the stored locations are updated on the server with the new tidings. Even if the organisation who hosts the server may take an interest in finding out who the infected person is, the mobile app and the server only share a list of locations (hubs), and the time the user was at a certain spot, which now have an increased risk of passing an infection. The user only interacts with the server through an anonymised id, and does not have to provide personal data.
This brings us to the second function of the app, namely the virtual 'safety bubble' that the user can configure. Depending on personality, profession or otherwise, the user can enter whether she would like a high level of safety, or if she is willing to take some risk in becoming infected. Either option comes with a certain trade-off:
- A high safety setting will make it increasingly difficult to navigate safely in busy places
- A high risk setting will increase the chance of infection
This is called a normatively neutral setting, which means that there is no 'ideal' value that applies for everyone, and could lead to biased input. The only setting you can enter is the one that suits you best.
The mobile app uses this setting in three ways:
- It will instruct or advice the user if she comes near a hub with an increased risk of infection, and suggest alternatives.
- The app will register how often the user transgresses on her own settings, which is a measure of her reliability to keep to her preference. The app can suggest to change her preferences if this occurs.
- The app will notify the user if she comes near the safety bubble of someone else, and she has an above average risk of being infected by COVID-19, based on her tracking history. The user will be offered an alternative direction to slalom around the person in question. The system therefore does not point out infected persons, but merely asks you to respect the other's safety bubble, if there is reason to do so.
It is worth stressing again that none of these encounters are based on the actual infections of people. Rather everyone (and every hub) has a certain risk of carrying a certain infectious disease, based on the tracking history. These data are used to promote civil behaviour between people.
It will also be clear that this app will not prevent someone from catching COVID-19, so what then is the benefit of such an app? This is where symbiotic networks come into play!
Symbiotic NetworksThe theory of symbiotic networks suggests that if agents :
- have a certain behaviour
- are able to emit stress signals if they are not happy with something
- are able to change their behaviour, based on the stress signals of others, in order to attempt to decrease the total stress in the network
the total stress will of the network will always decrease to a minimal value. This value is preferably zero, but this ideal is in part determined on the constraints of the environment the agents operate in.
The astute reader may immediately see the relation to the 'lock-down' that many countries implemented just after COVID-19 broke out. There was a clear stress amongst people as the fear of infection spread throughout the world, and people (and governments) responded to these stress signals by changing their behaviour, for instance through social distancing. However, the resulting symbiotic network was tremendously crude, resulting in numerous perfectly healthy people in areas without recorded infections, who were trying to avoid each other, 'just in case'.
The app that is described above, describes a more targeted and local 'lock-down' advisor, adhering to the requirements of a symbiotic network. It already implements a few strategies to stimulate a change in behaviour of the user, but targeted to the specific areas she finds herself in. If the advices generated by the app are followed up by large amount of people, the overall risk of infection will already decrease! As a result, the overall behaviour of the network will contribute to reducing the infamous R-Number of an infectious disease, the number when the risk of infecting another person becomes less than one. The network therefore does not work on individual, but collective behaviour, that ultimately also benefits the individual!
The server can track the risk of infection, and adjust the advice accordingly. This can already be achieved by any social distancing app, and in fact, the example described above does not really require any sophisticated technology to implement. Simple social distancing apps could be implemented with an Arduino with little more than Bluetooth and a wireless connection. Even the server application is quite straightforward, albeit quite data-intensive, to implement. For this reason, this system is extremely suited for developing countries, because tracking apps based on this system can be extremely inexpensive.
But the big extra of a full-fledged symbiotic network lies in its ability to learn!
Simulating a Symbiotic Network for COVID-19In the simulation we present here, the hubs are equipped with a mechanism to mutually learn patterns, based on how the risk of contagion (RoC) percolates through the network. If a certain hub notices a change in its own RoC, it sends out a signal to the other hubs, who then assess if this change may have come from them. Based on this, a certain probability is calculated that there is a relationship between these hubs. If the relationship is coincidental, it will dampen out over time, but otherwise this relationship will become increasingly stronger and more enduring.
Suppose we translate this to a real life COVID-19 scenario; if the city of Arnhem has a lot of commuters living in Deventer, who happen to live in the Colmschate area, then the system will learn that an increasing RoC in Arnhem will result in the same happening in Colmschate a few days later. In other words, the system can predict that the local supermarket there will face the problem of becoming an infection zone before it actually happens. If that particular supermarket takes precautionary measures, it will not spread the infection, as the wave passes.
As a result, one of the prime reasons to focus on all kinds of diseases and calamities, instead of concentrating on COVID-19 alone, is because this allows the system to learn much faster; the common cold provides the training sets that can be used when a more threatening disease starts to spread! The system can even learn from other calamities, such as an explosion in a factory, that releases dangerous toxins. As the reports start coming in of people feeling ill, the system can infer by the specific spatial patterns, that a toxic cloud is spreading. By connecting the network to data sources from health organisations, weather forecasting services and so on, the system can become highly granular over time. Another advantage of creating a generic tracking app is that users become accustomed to interacting with, and consulting the app on a daily basis.
Contributing to the COVID-19 ChallengeOur contribution to the COVID-19 Challenge on Hackster.io is a simulation of how a symbiotic network could be implemented to create a personalised 'lock-down' advisor. It consists of two parts, namely the simulation environment depicted in the above figure, and a mock-up, but functioning mobile app that can interact with the simulation environment. The full simulator is depicted below
The simulator consists of a 'road' that is looking 16 days ahead into the future. When the simulation is started, a number of 'people' are created on the horizon, of which a few are infected with COVID-19. The amount of people created (density, 0-100%) and the amount of infected persons (0-100%) can be set with the corresponding sliders. Every iteration (or day) the existing population comes nearer, while a new population is created on the horizon. These create traces on the road, lines that come closer as the simulation proceeds. Infected people cause red lines to form on the road, which eventually die out as the incubation period passes. As a result, the traces look a bit like lava flowing towards you, which will have reached you after two weeks. The total simulation lasts sixty days, and as people may report an infection of which the incubation may have occurred earlier, it can happen that a red line suddenly pops up right in front of you. The simulation can be paused, stopped and cleared.
The Mobile AppThe mobile app interacts with this environment. It tries to follow the logic of any mobile app, and starts in the play store where you can download it by clicking on the image beneath 'download app'. After a while the app is registered with the simulator, and you can start the simulation. The mobile app now has the following shape:
We had already introduced the two sliders on the top earlier. If you adjust these, you will see that it affects the heart of the app, which is the cyan circle, with a white circle around it. The white circle represents your safety bubble, and becomes smaller the more risks you are willing to take. If you feel ill, the app will adjust the safety bubble (and the setting) accordingly.
The menu bar on the top right of the mobile app contains mock-ups of settings that correspond to the use case we described earlier. One particular menu is the 'health' setting, which is loosely based on an existing app from a Dutch hospital. If you adjust these settings, it will affect the safety bubble as well. All these settings only have a local effect in your mobile app, and nothing is sent to the server! You can return to the main screen by clicking the red corona image on the top left of the app.
Besides the circle, there are two graphs on the app, which do require interaction with the server:
- Three week forecast of possible infections
- Difference in risk of infection when protection is disabled or enabled. In the latter case, the system will try to navigate the mobile app in the background to a neighbouring hub with the lowest risk of infection, as example of a 'change of behaviour'
When you start the simulation, you will see the traces come nearer. After two weeks, the mobile app will start to interact with the system:
- A ring will form outside of the safety bubble, that can be partially green or red. This shows the risk of infection for the adjacent hubs, and is the base for the strategy that is performed when the system is protected. The top of the ring represents the hubs in front of the user, and the thickness is formed by 15 'slices' of one meter. If a part of the ring remains black, it means that that hub has not been crossed yet by anyone.
- The bottom graph demonstrates how the RoC will proceed if protection is disabled (red) or enabled (green). As the simulation is dynamic, every test run will give different results, and sometimes it may happen that protection gives a worse outcome than the unprotected mode. On average, however, protected mode gives a significant reduction of the RoC.
- The forecast graph above the safety bubble shows how the symbiotic network is learning. As the movement of the traces on the road is generally fairly vertical, the system tends to learn that infections of the population in the centre of the road is a likely prediction of an oncoming infection.
- If the density and the infections are increased, both the forecast graph and the bottom graph will yield higher values. It will become increasingly difficult for the protected mode to find a safe refuge, and the symbiotic network will learn that any infection earlier in time is cause for concern.
The simulator is a demonstrator on how a symbiotic network can be used in a tracking app for COVID-19. The code base, which can be found on GitHub, is largely prepared for real application. The mobile app, and the interaction with the simulator is possible through a number of REST services, which would allow other contributors to interact with the simulator. If anyone is interested to develop an IoT device that interacts with the simulator, please do not hesitate to contact me!


Comments