

Hardware components | ||||||
 |
| × | 1 | |||
Software apps and online services | ||||||
 |
| |||||
 |
| |||||
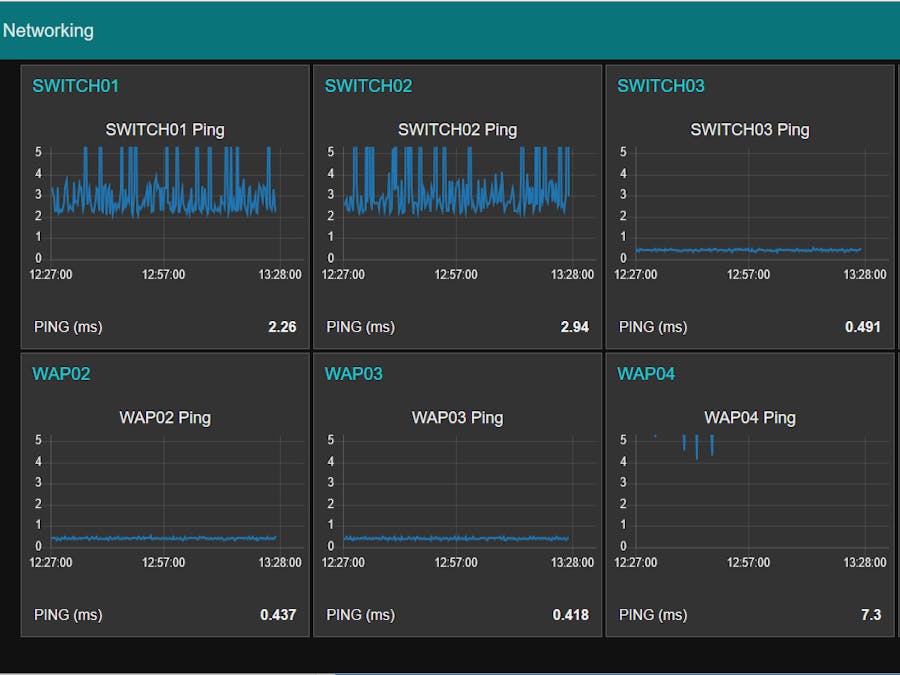
I used a plain Raspberry Pi 3 connected to my home network to monitor some network devices and servers I am running in my lab.
I used Node-Red to create a flow per monitored device, at the moment, but this needs to be improved so the flow only needs to be created once and reads the monitored devices from a list.
The flow checks whether the device answers to ping. If it does not, it will send an e-mail containing the server name and display a toast on the monitoring website.
If it does answer, the flow will graph the response time in the UI.
I want to be able to monitor Windows servers internally, using WMIC or PowerShell. The Flows will need to be run on a Windows device for that. Have not yet had any success implementing this on Windows 10 IoT on a Raspberry Pi :(
Let me know if you have any questions or comments.
El Condor
Example Flow for Node-Red
JavaScriptDon't forget to define a mail user. The Ping checks will need the host to be an IP address or FQDN.
For this basic flow you can implement a specific Device Type Tab on which you can display ping statistics and service states per Device. I will release two additional nodes that implement a Dashboard with just the host states aggregated on one Dashboard Tab.
[
    {
        "id": "b0f48f9d.66cd7",
        "type": "ping",
        "z": "44a9c552.ab298c",
        "name": "SWITCH01 Check",
        "host": "SWITCH01.de-baay.nl",
        "timer": "20",
        "x": 159,
        "y": 135,
        "wires": [
            [
                "2727401a.d768a"
            ]
        ]
    },
    {
        "id": "8215c14d.3f7e9",
        "type": "function",
        "z": "44a9c552.ab298c",
        "name": "Which Server?",
        "func": "switch (msg.topic){\n    case 'SWITCH01.de-baay.nl':\n        return [ msg,null ];\n    case 'SWITCH02.de-baay.nl':\n        return [ null,msg ];\n}\n",
        "outputs": "2",
        "noerr": 0,
        "x": 1202,
        "y": 118,
        "wires": [
            [
                "9424e6.bc861b18",
                "bb836bdc.2703a8",
                "4adccf0d.5ddc6"
            ],
            []
        ]
    },
    {
        "id": "bb836bdc.2703a8",
        "type": "ui_text",
        "z": "44a9c552.ab298c",
        "group": "624ead05.4ac084",
        "order": 0,
        "width": 0,
        "height": 0,
        "name": "PING Value (SWITCH01)",
        "label": "PING (ms)",
        "format": "{{msg.payload}}",
        "layout": "row-spread",
        "x": 1607,
        "y": 126.80000305175781,
        "wires": []
    },
    {
        "id": "9424e6.bc861b18",
        "type": "ui_chart",
        "z": "44a9c552.ab298c",
        "name": "Ping Chart (SWITCH01)",
        "group": "624ead05.4ac084",
        "order": 0,
        "width": 0,
        "height": 0,
        "label": "SWITCH01 Ping",
        "chartType": "line",
        "legend": "false",
        "xformat": "HH:mm:ss",
        "interpolate": "linear",
        "nodata": "",
        "ymin": "0",
        "ymax": "5",
        "removeOlder": 1,
        "removeOlderPoints": "",
        "removeOlderUnit": "3600",
        "cutout": 0,
        "colors": [
            "#1f77b4",
            "#aec7e8",
            "#ff7f0e",
            "#2ca02c",
            "#98df8a",
            "#d62728",
            "#ff9896",
            "#9467bd",
            "#c5b0d5"
        ],
        "x": 1604,
        "y": 76.80000305175781,
        "wires": [
            [],
            []
        ]
    },
    {
        "id": "e3bfc194.5db2a",
        "type": "link in",
        "z": "44a9c552.ab298c",
        "name": "",
        "links": [],
        "x": 1007,
        "y": 119,
        "wires": [
            [
                "8215c14d.3f7e9"
            ]
        ]
    },
    {
        "id": "2727401a.d768a",
        "type": "link out",
        "z": "44a9c552.ab298c",
        "name": "",
        "links": [],
        "x": 334,
        "y": 136,
        "wires": []
    },
    {
        "id": "ecaa4ccc.03f37",
        "type": "link in",
        "z": "44a9c552.ab298c",
        "name": "IncomingIsAlive?",
        "links": [],
        "x": 479,
        "y": 142,
        "wires": [
            [
                "d59299ae.f1aee8"
            ]
        ]
    },
    {
        "id": "d59299ae.f1aee8",
        "type": "function",
        "z": "44a9c552.ab298c",
        "name": "IsAlive?",
        "func": "var hostName = msg.topic;\nif (msg.payload === false && !context[msg.topic]) \n{\n    context[hostName] = msg.topic;\n    return [ msg, msg ];\n} \nelse if (msg.payload > 0) \n{\n   if (msg.topic === context[hostName]) \n   {\n        context[hostName] = false;\n   }\n    return [ null, msg ];\n}",
        "outputs": "2",
        "noerr": 0,
        "x": 677.1166687011719,
        "y": 143.16668701171875,
        "wires": [
            [
                "3e7da52b.56c7fa"
            ],
            [
                "801dd9da.323f78"
            ]
        ]
    },
    {
        "id": "3e7da52b.56c7fa",
        "type": "link out",
        "z": "44a9c552.ab298c",
        "name": "OutGoingErrorAlive",
        "links": [],
        "x": 886.9999389648438,
        "y": 118.23333740234375,
        "wires": []
    },
    {
        "id": "801dd9da.323f78",
        "type": "link out",
        "z": "44a9c552.ab298c",
        "name": "OutGoingAlive",
        "links": [],
        "x": 881.9999389648438,
        "y": 188.23333740234375,
        "wires": []
    },
    {
        "id": "b1196181.a36c9",
        "type": "comment",
        "z": "44a9c552.ab298c",
        "name": "To Error Input",
        "info": "",
        "x": 1008,
        "y": 188,
        "wires": []
    },
    {
        "id": "9836850a.6ee388",
        "type": "comment",
        "z": "44a9c552.ab298c",
        "name": "From Device Flow to Common Nodes",
        "info": "You can place the IsAlive check on a separate Flow.\nThen place devices and hosts on a separate Flow.\nConnect them using link nodes.\nOtherwise you would have to maintain the code for \nthe IsAlive node in multiple locations",
        "x": 435,
        "y": 85,
        "wires": []
    },
    {
        "id": "b3a7ce00.fccbf",
        "type": "comment",
        "z": "44a9c552.ab298c",
        "name": "From Common Nodes to Device Flow",
        "info": "This is to return from the common nodes flow \nto the device flow",
        "x": 944,
        "y": 69,
        "wires": []
    },
    {
        "id": "d13ab0d3.8d19",
        "type": "comment",
        "z": "44a9c552.ab298c",
        "name": "To Error Handling on Common Nodes Flow",
        "info": "",
        "x": 1060,
        "y": 899,
        "wires": []
    },
    {
        "id": "248aac12.650104",
        "type": "comment",
        "z": "44a9c552.ab298c",
        "name": "Error Input",
        "info": "This Link group should be placed on the Device flow \nto link back from the Device flow to the \nCommon Nodes flow error nodes",
        "x": 990,
        "y": 974,
        "wires": []
    },
    {
        "id": "713417d9.e9e4e8",
        "type": "link in",
        "z": "44a9c552.ab298c",
        "name": "Emailing",
        "links": [],
        "x": 1101,
        "y": 972,
        "wires": [
            [
                "fe55ccde.8d571",
                "e1f789f8.6c2448"
            ]
        ]
    },
    {
        "id": "fe55ccde.8d571",
        "type": "function",
        "z": "44a9c552.ab298c",
        "name": "FormatCommonEMail",
        "func": "var today = new Date();\nvar dd = today.getDate();\nvar MM = today.getMonth()+1; //January is 0!\nvar yyyy = today.getFullYear();\nif(dd<10) {\n    dd='0'+dd;\n} \nif(MM<10) {\n    MM='0'+MM;\n} \nvar mm = today.getMinutes();\nvar hh = today.getHours();\nvar ss = today.getSeconds();\ntoday = dd+'-'+MM+'-'+yyyy;\ntime = hh+':'+mm+':'+ss\nif (msg.Temp)\n{\n\tvar Temp = msg.payload;\n\tmsg.topic = \"Temperature in server room is \" + Temp + \"!!\";\n\tmsg.payload = \"This is a message from environment watch. The Temperature in the server room is \" + Temp + \". This is too high, someone should look into it!\\r\\nTime Event: \"+time+\" on \"+today;\n\treturn msg;\n}\nif (msg.Service)\n{\n\tvar hostName = msg.topic;\n\tvar service = msg.service\n\tmsg.topic = hostName + \" \" + service + \" is down!!\";\n\tmsg.payload = \"This is a message from \" + hostName + \": the \" + service + \" Service is down.\\r\\nTime Event: \"+time+\" on \"+today;\n\treturn msg;\n}\nelse\n{\n\tvar hostName = msg.topic;\n\tvar tripTime = msg.tripTime;\n\tmsg.topic = hostName + \" is down!!\";\n\tmsg.payload = \"This is a message from \" + hostName + \": the server is down.\\r\\nTime Event: \"+time+\" on \"+today;\n\treturn msg;\n}",
        "outputs": 1,
        "noerr": 0,
        "x": 1349,
        "y": 941,
        "wires": [
            [
                "4725fbd9.731704"
            ]
        ]
    },
    {
        "id": "e1f789f8.6c2448",
        "type": "function",
        "z": "44a9c552.ab298c",
        "name": "Create Common Down notification",
        "func": "if (msg.Temp)\n{\n\tvar Temp = msg.payload;\n\tmsg.payload = \"Temperature in Serverroom is \" + Temp + \"!!!\";\n\treturn msg;\n}\nif (msg.Service)\n{\n\tvar hostName = msg.topic;\n\tvar service = msg.service;\n\tmsg.payload = service + \" on \" + hostName + \" is DOWN!!!\";\n\treturn msg;\n}\nelse\n{\n\tvar hostName = msg.topic;\n\tmsg.payload = hostName + \" is DOWN!!!\";\n\treturn msg;\n}",
        "outputs": 1,
        "noerr": 0,
        "x": 1388,
        "y": 1004,
        "wires": [
            [
                "c7751bdf.137298"
            ]
        ]
    },
    {
        "id": "4725fbd9.731704",
        "type": "e-mail",
        "z": "44a9c552.ab298c",
        "server": "smtp.gmail.com",
        "port": "465",
        "secure": true,
        "name": "administrator@domain.com",
        "dname": "Send Email Server Down",
        "x": 1684,
        "y": 940,
        "wires": []
    },
    {
        "id": "c7751bdf.137298",
        "type": "ui_toast",
        "z": "44a9c552.ab298c",
        "position": "top right",
        "displayTime": "3",
        "highlight": "",
        "outputs": 0,
        "ok": "OK",
        "cancel": "",
        "topic": "",
        "name": "Down notification",
        "x": 1699.5,
        "y": 1003,
        "wires": []
    },
    {
        "id": "624ead05.4ac084",
        "type": "ui_group",
        "z": "",
        "name": "Device Demo",
        "tab": "5d4a8e6d.cdb3e",
        "order": 2,
        "disp": true,
        "width": "6"
    },
    {
        "id": "5d4a8e6d.cdb3e",
        "type": "ui_tab",
        "z": "",
        "name": "Code Demo",
        "icon": "dashboard",
        "order": 6
    }
]
Example code for monitoring HTTP
JavaScriptSome servers require another type of request than others (I found that using HTTP/1.0 in stead of 1.1 sometimes works better.
Also the status codes returned by some servers may not always be what you expect. Ideally you should expect a 200 OK code. This is what my code checks for, but if you find another HTTP status (like 301 or Permission Denied) then you may want to change your error conditions.
[
    {
        "id": "880288a4.ac6048",
        "type": "inject",
        "z": "44a9c552.ab298c",
        "name": "Start Polling HTTP",
        "topic": "",
        "payload": "",
        "payloadType": "date",
        "repeat": "",
        "crontab": "",
        "once": true,
        "x": 145,
        "y": 392,
        "wires": [
            [
                "58cd469.4e610b8"
            ]
        ]
    },
    {
        "id": "58cd469.4e610b8",
        "type": "function",
        "z": "44a9c552.ab298c",
        "name": "WWW.domain.com GET Request",
        "func": "msg.payload = \"GET / HTTP/1.0\\r\\n\\r\\nHostname: www.domain.com\";\nmsg.topic = \"www.domain.com\";\nreturn msg;",
        "outputs": 1,
        "noerr": 0,
        "x": 459,
        "y": 392,
        "wires": [
            [
                "feea1b04.50d9d8"
            ]
        ]
    },
    {
        "id": "feea1b04.50d9d8",
        "type": "tcp request",
        "z": "44a9c552.ab298c",
        "server": "www.domain.com",
        "port": "80",
        "out": "time",
        "splitc": "1000",
        "name": "HTTP Tester",
        "x": 724,
        "y": 392,
        "wires": [
            [
                "7ced1f03.8c15f"
            ]
        ]
    },
    {
        "id": "7ced1f03.8c15f",
        "type": "function",
        "z": "44a9c552.ab298c",
        "name": "Parse Response",
        "func": "var serviceName = msg.topic;\nmsg.payload = msg.payload.toString('utf8');\nmsg.Service = true;\n//statuscodes may depend on the response of the server\nif (msg.payload.substring(0,12)=== \"HTTP/1.1 200\")\n{\n    msg.payload = true;\n    msg.service = \"HTTP\";\n    if (msg.topic === context[serviceName])\n        {\n            context[serviceName] = false;\n        }\n    switch (msg.topic)\n    {\n        case \"www.domain.com\":\n            return [msg, null];\n    }\n}\nelse if (!context[serviceName])\n{\n    msg.payload = false;\n    msg.service = \"HTTP\";\n    context[serviceName] = msg.topic;\n    switch (msg.topic)\n    {\n        case \"www.domain.com\":\n            return [msg, msg];\n    }\n}",
        "outputs": "2",
        "noerr": 0,
        "x": 1114,
        "y": 392,
        "wires": [
            [
                "e0e76a4.76ca298"
            ],
            [
                "147d4da9.fd8042"
            ]
        ]
    },
    {
        "id": "e0e76a4.76ca298",
        "type": "ui_switch",
        "z": "44a9c552.ab298c",
        "name": "HTTP Available",
        "label": "Photo Website Available",
        "group": "624ead05.4ac084",
        "order": 0,
        "width": 0,
        "height": 0,
        "passthru": false,
        "topic": "",
        "style": "",
        "onvalue": "true",
        "onvalueType": "bool",
        "onicon": "check_circle",
        "oncolor": "green",
        "offvalue": "false",
        "offvalueType": "bool",
        "officon": "check_circle",
        "offcolor": "red",
        "x": 1442,
        "y": 385,
        "wires": [
            []
        ]
    },
    {
        "id": "147d4da9.fd8042",
        "type": "link out",
        "z": "44a9c552.ab298c",
        "name": "",
        "links": [],
        "x": 1378,
        "y": 452,
        "wires": []
    },
    {
        "id": "a115f54b.19bd08",
        "type": "comment",
        "z": "44a9c552.ab298c",
        "name": "To Error Input",
        "info": "",
        "x": 1494,
        "y": 450,
        "wires": []
    },
    {
        "id": "624ead05.4ac084",
        "type": "ui_group",
        "z": "",
        "name": "Device Demo",
        "tab": "5d4a8e6d.cdb3e",
        "order": 2,
        "disp": true,
        "width": "6"
    },
    {
        "id": "5d4a8e6d.cdb3e",
        "type": "ui_tab",
        "z": "",
        "name": "Code Demo",
        "icon": "dashboard",
        "order": 6
    }
]
Example code for monitoring HTTPS
JavaScriptThe parse function takes multiple servers into account but for the sake of simplicity I have not included that code here
[
    {
        "id": "75b24d38.9fccd4",
        "type": "inject",
        "z": "44a9c552.ab298c",
        "name": "Start Polling HTTPS",
        "topic": "",
        "payload": "",
        "payloadType": "date",
        "repeat": "",
        "crontab": "",
        "once": true,
        "x": 147,
        "y": 481,
        "wires": [
            [
                "517bde7c.5dbb2"
            ]
        ]
    },
    {
        "id": "517bde7c.5dbb2",
        "type": "https-node",
        "z": "44a9c552.ab298c",
        "name": "HTTPS GET Request",
        "method": "GET",
        "ret": "txt",
        "url": "https://mail.domain.com/owa",
        "authorized": false,
        "agent": true,
        "x": 525.11669921875,
        "y": 482.2166748046875,
        "wires": [
            [
                "effb9616.df7b38"
            ]
        ]
    },
    {
        "id": "effb9616.df7b38",
        "type": "function",
        "z": "44a9c552.ab298c",
        "name": "Parse Response",
        "func": "var serviceName = msg.topic;\nmsg.Service = true;\nif (msg.statusCode===301)\n{\n    msg.payload = true;\n    msg.service = \"HTTPS\";\n    if (msg.topic === context[serviceName])\n        {\n            context[serviceName] = false;\n        }\n    return [msg, null];\n}\nelse if (!context[serviceName])\n{\n    msg.payload = false;\n    msg.service = \"HTTPS\";\n    context[serviceName] = msg.topic;\n    return [msg, msg];\n}",
        "outputs": "2",
        "noerr": 0,
        "x": 1111.9833984375,
        "y": 487.0333251953125,
        "wires": [
            [
                "8f9b0dd5.f4833"
            ],
            []
        ]
    },
    {
        "id": "8f9b0dd5.f4833",
        "type": "ui_switch",
        "z": "44a9c552.ab298c",
        "name": "HTTPS Available",
        "label": "Webmail Available",
        "group": "624ead05.4ac084",
        "order": 0,
        "width": 0,
        "height": 0,
        "passthru": false,
        "topic": "",
        "style": "",
        "onvalue": "true",
        "onvalueType": "bool",
        "onicon": "check_circle",
        "oncolor": "green",
        "offvalue": "false",
        "offvalueType": "bool",
        "officon": "check_circle",
        "offcolor": "red",
        "x": 1453,
        "y": 503.0000305175781,
        "wires": [
            []
        ]
    },
    {
        "id": "624ead05.4ac084",
        "type": "ui_group",
        "z": "",
        "name": "Device Demo",
        "tab": "5d4a8e6d.cdb3e",
        "order": 2,
        "disp": true,
        "width": "6"
    },
    {
        "id": "5d4a8e6d.cdb3e",
        "type": "ui_tab",
        "z": "",
        "name": "Code Demo",
        "icon": "dashboard",
        "order": 6
    }
]
Example code for monitoring FTP
JavaScript[
{
"id": "e45cb6a5.ceb038",
"type": "inject",
"z": "44a9c552.ab298c",
"name": "Start Polling FTP",
"topic": "",
"payload": "",
"payloadType": "date",
"repeat": "",
"crontab": "",
"once": true,
"x": 150,
"y": 559,
"wires": [
[
"160d7d9.7a83c82"
]
]
},
{
"id": "160d7d9.7a83c82",
"type": "function",
"z": "44a9c552.ab298c",
"name": "FTP.domain.com Request",
"func": "msg.topic = \"FTP.domain.com\";\nreturn msg;",
"outputs": 1,
"noerr": 0,
"x": 450,
"y": 560,
"wires": [
[
"84d3313a.b85cf"
]
]
},
{
"id": "84d3313a.b85cf",
"type": "tcp request",
"z": "44a9c552.ab298c",
"server": "FTP.domain.com",
"port": "21",
"out": "time",
"splitc": "1000",
"name": "FTP Tester",
"x": 745,
"y": 560,
"wires": [
[
"52ec8865.da4808"
]
]
},
{
"id": "52ec8865.da4808",
"type": "function",
"z": "44a9c552.ab298c",
"name": "Parse Response",
"func": "var serviceName = msg.topic;\nmsg.payload = msg.payload.toString('utf8');\nmsg.Service = true;\nif (msg.payload.substring(0,3)=== \"220\")\n{\n msg.payload = true;\n msg.service = \"FTP\";\n if (msg.topic === context[serviceName])\n {\n context[serviceName] = false;\n }\n switch (msg.topic)\n {\n case \"FTP.domain.com\":\n return [msg, null];\n }\n}\nelse if (!context[serviceName])\n{\n msg.payload = false;\n msg.service = \"FTP\";\n context[serviceName] = msg.topic;\n switch (msg.topic)\n {\n case \"domain.com\":\n return [msg, msg];\n }\n}",
"outputs": "2",
"noerr": 0,
"x": 1114,
"y": 561,
"wires": [
[
"32cbe1bc.5b731e"
],
[
"3b59d5aa.4700ea"
]
]
},
{
"id": "32cbe1bc.5b731e",
"type": "ui_switch",
"z": "44a9c552.ab298c",
"name": "FTP Available",
"label": "FTP Service Available",
"group": "624ead05.4ac084",
"order": 0,
"width": 0,
"height": 0,
"passthru": false,
"topic": "",
"style": "",
"onvalue": "true",
"onvalueType": "bool",
"onicon": "check_circle",
"oncolor": "green",
"offvalue": "false",
"offvalueType": "bool",
"officon": "check_circle",
"offcolor": "red",
"x": 1450,
"y": 554,
"wires": [
[]
]
},
{
"id": "3b59d5aa.4700ea",
"type": "link out",
"z": "44a9c552.ab298c",
"name": "",
"links": [],
"x": 1380,
"y": 600,
"wires": []
},
{
"id": "1403cdbd.d5a042",
"type": "comment",
"z": "44a9c552.ab298c",
"name": "To Error Input",
"info": "",
"x": 1493,
"y": 600,
"wires": []
},
{
"id": "624ead05.4ac084",
"type": "ui_group",
"z": "",
"name": "Device Demo",
"tab": "5d4a8e6d.cdb3e",
"order": 2,
"disp": true,
"width": "6"
},
{
"id": "5d4a8e6d.cdb3e",
"type": "ui_tab",
"z": "",
"name": "Code Demo",
"icon": "dashboard",
"order": 6
}
]
Example code for monitoring SMTP
JavaScriptWhen a valid response is received, the switch will be green (true), indicating the service is up. When an invalid response is received the switch will be set to false and display a red icon. I changed this from the gauge that was used before. I discovered that the usage of a switch was possible. Even to customize it to my liking using Material Design Icons.
The output should be placed in the same UI group as the server/device the service is running on.
[
    {
        "id": "d56c3996.16ec98",
        "type": "inject",
        "z": "44a9c552.ab298c",
        "name": "Start Polling SMTP",
        "topic": "",
        "payload": "",
        "payloadType": "date",
        "repeat": "",
        "crontab": "",
        "once": false,
        "x": 155,
        "y": 265,
        "wires": [
            [
                "f9ac1efa.5ea6b"
            ]
        ]
    },
    {
        "id": "f9ac1efa.5ea6b",
        "type": "function",
        "z": "44a9c552.ab298c",
        "name": "SMTP mail.de-baay.nl",
        "func": "msg.topic = \"mail.domain.com\";\nreturn msg;",
        "outputs": 1,
        "noerr": 0,
        "x": 466,
        "y": 265,
        "wires": [
            [
                "8303cb44.3f53f8"
            ]
        ]
    },
    {
        "id": "8303cb44.3f53f8",
        "type": "tcp request",
        "z": "44a9c552.ab298c",
        "server": "mail.domain.com",
        "port": "25",
        "out": "time",
        "splitc": "1000",
        "name": "SMTP Tester",
        "x": 720,
        "y": 265,
        "wires": [
            [
                "e08be960.7ed068"
            ]
        ]
    },
    {
        "id": "e08be960.7ed068",
        "type": "function",
        "z": "44a9c552.ab298c",
        "name": "Parse Response",
        "func": "var serviceName = msg.topic;\nmsg.payload = msg.payload.toString('utf8');\nmsg.Service = true;\nif (msg.payload.substring(0,3)=== \"220\")\n{\n    msg.payload = true;\n    if (msg.topic === context[serviceName])\n    {\n        context[serviceName] = false;\n    }\n    switch (msg.topic)\n    {\n        case \"mail.domain.com\":\n            return [msg,null];\n    }\n}\nelse\n{\n    msg.payload = false;\n    if (!context[serviceName])\n    {\n        msg.service = \"SMTP\";\n        context[serviceName] = msg.topic;\n        switch (msg.topic)\n        {\n            case \"mail.domain.com\":\n                return [msg,msg];\n        }\n    }\n}",
        "outputs": "2",
        "noerr": 0,
        "x": 1099,
        "y": 265,
        "wires": [
            [
                "391c5cba.3142b4"
            ],
            [
                "feedd771.537d98"
            ]
        ]
    },
    {
        "id": "391c5cba.3142b4",
        "type": "ui_switch",
        "z": "44a9c552.ab298c",
        "name": "SMTP Available",
        "label": "SMTP Available (MAIL.DOMAIN.COM)",
        "group": "624ead05.4ac084",
        "order": 0,
        "width": 0,
        "height": 0,
        "passthru": false,
        "topic": "",
        "style": "",
        "onvalue": "true",
        "onvalueType": "bool",
        "onicon": "check_circle",
        "oncolor": "green",
        "offvalue": "false",
        "offvalueType": "bool",
        "officon": "check_circle",
        "offcolor": "red",
        "x": 1441,
        "y": 258,
        "wires": [
            []
        ]
    },
    {
        "id": "feedd771.537d98",
        "type": "link out",
        "z": "44a9c552.ab298c",
        "name": "",
        "links": [],
        "x": 1380,
        "y": 325,
        "wires": []
    },
    {
        "id": "888f767.5364f88",
        "type": "comment",
        "z": "44a9c552.ab298c",
        "name": "To Error Input",
        "info": "",
        "x": 1494,
        "y": 322,
        "wires": []
    },
    {
        "id": "624ead05.4ac084",
        "type": "ui_group",
        "z": "",
        "name": "Device Demo",
        "tab": "5d4a8e6d.cdb3e",
        "order": 2,
        "disp": true,
        "width": "6"
    },
    {
        "id": "5d4a8e6d.cdb3e",
        "type": "ui_tab",
        "z": "",
        "name": "Code Demo",
        "icon": "dashboard",
        "order": 6
    }
]
Example Nodes for Aggregated Overview
JavaScriptWhile the implementation is not the most user-friendly (it has to be repeated for every monitored device) the creation of an overview tab is a nice to have when monitoring a lot of devices and you want a quick status overview of the whole network.
The code generates a green or red checkbox depending on the ping of the server.
A ToDo might be that all monitored parts of one server (ping, services, etc) determine whether the checkbox is green yellow or red (red being, server is down, yellow being service is down, server responds, green being, well, all green :) )
I am inventing this as I am typing this, so may take a while before I will be able to implement this.
[
    {
        "id": "4adccf0d.5ddc6",
        "type": "function",
        "z": "44a9c552.ab298c",
        "name": "PingToBoolean",
        "func": "if (msg.payload)\n{\n    msg.payload = true;\n}\nelse\n{\n    msg.payload = false;\n}\nreturn msg;",
        "outputs": 1,
        "noerr": 0,
        "x": 1577,
        "y": 170,
        "wires": [
            [
                "b548cf1b.8c126"
            ]
        ]
    },
    {
        "id": "b548cf1b.8c126",
        "type": "ui_switch",
        "z": "44a9c552.ab298c",
        "name": "Status (SWITCH01)",
        "label": "SWITCH01 Online?",
        "group": "affef727.453738",
        "order": 0,
        "width": 0,
        "height": 0,
        "passthru": false,
        "topic": "",
        "style": "",
        "onvalue": "true",
        "onvalueType": "bool",
        "onicon": "check_circle",
        "oncolor": "green",
        "offvalue": "false",
        "offvalueType": "bool",
        "officon": "check_circle",
        "offcolor": "red",
        "x": 1809,
        "y": 170,
        "wires": [
            []
        ]
    },
    {
        "id": "affef727.453738",
        "type": "ui_group",
        "z": "",
        "name": "Dashboard Demo",
        "tab": "5d4a8e6d.cdb3e",
        "order": 1,
        "disp": true,
        "width": "6"
    },
    {
        "id": "5d4a8e6d.cdb3e",
        "type": "ui_tab",
        "z": "",
        "name": "Code Demo",
        "icon": "dashboard",
        "order": 6
    }
]
Example code for monitoring temperature
JavaScriptThe flow contains output nodes to the Dashboard and a device Tab. I was planning to use this as an Environment monitoring Tab on which more environment check may be displayed in the future.
Refer to these links https://www.google.nl/search?q=check+ds18b20+functionality+raspberry+pi&ie=utf-8&oe=utf-8&client=firefox-b&gfe_rd=cr&ei=nbH5WIiABpHSXoPtlfgN to find out how to set up temperature monitoring with the ds18b20.
[
    {
        "id": "a5be657a.f641e8",
        "type": "inject",
        "z": "44a9c552.ab298c",
        "name": "Trigger Temp Sensor",
        "topic": "",
        "payload": "",
        "payloadType": "date",
        "repeat": "",
        "crontab": "",
        "once": true,
        "x": 148,
        "y": 765,
        "wires": [
            [
                "22c83a4f.099406"
            ]
        ]
    },
    {
        "id": "22c83a4f.099406",
        "type": "rpi-ds18b20",
        "z": "44a9c552.ab298c",
        "topic": "",
        "array": false,
        "name": "Temp sensor",
        "x": 434,
        "y": 768,
        "wires": [
            [
                "2321376c.6859c8",
                "fe5f90ac.d02da",
                "28e1929f.89f7ce",
                "84e57eec.46eac"
            ]
        ]
    },
    {
        "id": "2321376c.6859c8",
        "type": "ui_gauge",
        "z": "44a9c552.ab298c",
        "name": "",
        "group": "624ead05.4ac084",
        "order": 0,
        "width": 0,
        "height": 0,
        "gtype": "gage",
        "title": "Temperature",
        "label": "Temp in C°",
        "format": "{{value}}",
        "min": 0,
        "max": "60",
        "colors": [
            "#00b500",
            "#e6e600",
            "#ca3838"
        ],
        "x": 833,
        "y": 728,
        "wires": []
    },
    {
        "id": "84e57eec.46eac",
        "type": "ui_gauge",
        "z": "44a9c552.ab298c",
        "name": "",
        "group": "affef727.453738",
        "order": 0,
        "width": 0,
        "height": 0,
        "gtype": "gage",
        "title": "Temperature Dashboard",
        "label": "Temp in C°",
        "format": "{{value}}",
        "min": 0,
        "max": "60",
        "colors": [
            "#00b500",
            "#e6e600",
            "#ca3838"
        ],
        "x": 869,
        "y": 773,
        "wires": []
    },
    {
        "id": "fe5f90ac.d02da",
        "type": "ui_chart",
        "z": "44a9c552.ab298c",
        "name": "",
        "group": "624ead05.4ac084",
        "order": 0,
        "width": 0,
        "height": 0,
        "label": "Temperature in C°",
        "chartType": "line",
        "legend": "false",
        "xformat": "HH:mm:ss",
        "interpolate": "linear",
        "nodata": "",
        "ymin": "0",
        "ymax": "60",
        "removeOlder": 1,
        "removeOlderPoints": "",
        "removeOlderUnit": "3600",
        "cutout": 0,
        "colors": [
            "#1f77b4",
            "#aec7e8",
            "#ff7f0e",
            "#2ca02c",
            "#98df8a",
            "#d62728",
            "#ff9896",
            "#9467bd",
            "#c5b0d5"
        ],
        "x": 808,
        "y": 822,
        "wires": [
            [],
            []
        ]
    },
    {
        "id": "28e1929f.89f7ce",
        "type": "function",
        "z": "44a9c552.ab298c",
        "name": "TempTooHigh?",
        "func": "msg.Temp = true;\nif (msg.payload > 30 && !context.sentAlert) {\n   context.sentAlert = msg.topic;\n   return [ msg, null ];\n} else if (msg.payload < 30) {\n       if (context.sentAlert === msg.topic)\n    {\n        context.sentAlert = false;\n    }\n   return [ null, msg ];\n}",
        "outputs": "2",
        "noerr": 0,
        "x": 836.625,
        "y": 870.75,
        "wires": [
            [
                "ac17ff19.ebf58"
            ],
            []
        ]
    },
    {
        "id": "ac17ff19.ebf58",
        "type": "link out",
        "z": "44a9c552.ab298c",
        "name": "Environment E-Mail",
        "links": [],
        "x": 1027,
        "y": 864,
        "wires": []
    },
    {
        "id": "84047541.b23e58",
        "type": "comment",
        "z": "44a9c552.ab298c",
        "name": "To Error Input",
        "info": "",
        "x": 1159,
        "y": 864,
        "wires": []
    },
    {
        "id": "624ead05.4ac084",
        "type": "ui_group",
        "z": "",
        "name": "Device Demo",
        "tab": "5d4a8e6d.cdb3e",
        "order": 2,
        "disp": true,
        "width": "6"
    },
    {
        "id": "affef727.453738",
        "type": "ui_group",
        "z": "",
        "name": "Dashboard Demo",
        "tab": "5d4a8e6d.cdb3e",
        "order": 1,
        "disp": true,
        "width": "6"
    },
    {
        "id": "5d4a8e6d.cdb3e",
        "type": "ui_tab",
        "z": "",
        "name": "Code Demo",
        "icon": "dashboard",
        "order": 6
    }
]


Comments