


Hardware components | ||||||
 |
| × | 1 | |||
| × | 1 | ||||
 |
| × | 1 | |||
Software apps and online services | ||||||
 |
| |||||
 |
| |||||
In my continuing quest to see what the Windows IoT Core is capable of and my desire to push my gadgets to their limits, I came up with an interesting oscilloscope project using a Windows IoT Core-based Raspberry Pi 2 and a simple ADC. Now, I’m not claiming that you can just quickly build an oscilloscope using a Raspberry Pi 2 and an ADC and never need to spend the money on an oscilloscope ever again. The one shown in this project is limited in its temporal resolution to the millisecond range. For an oscilloscope, that’s slow, but it may be fast enough for some of your needs. In any case, I found it to be cool.
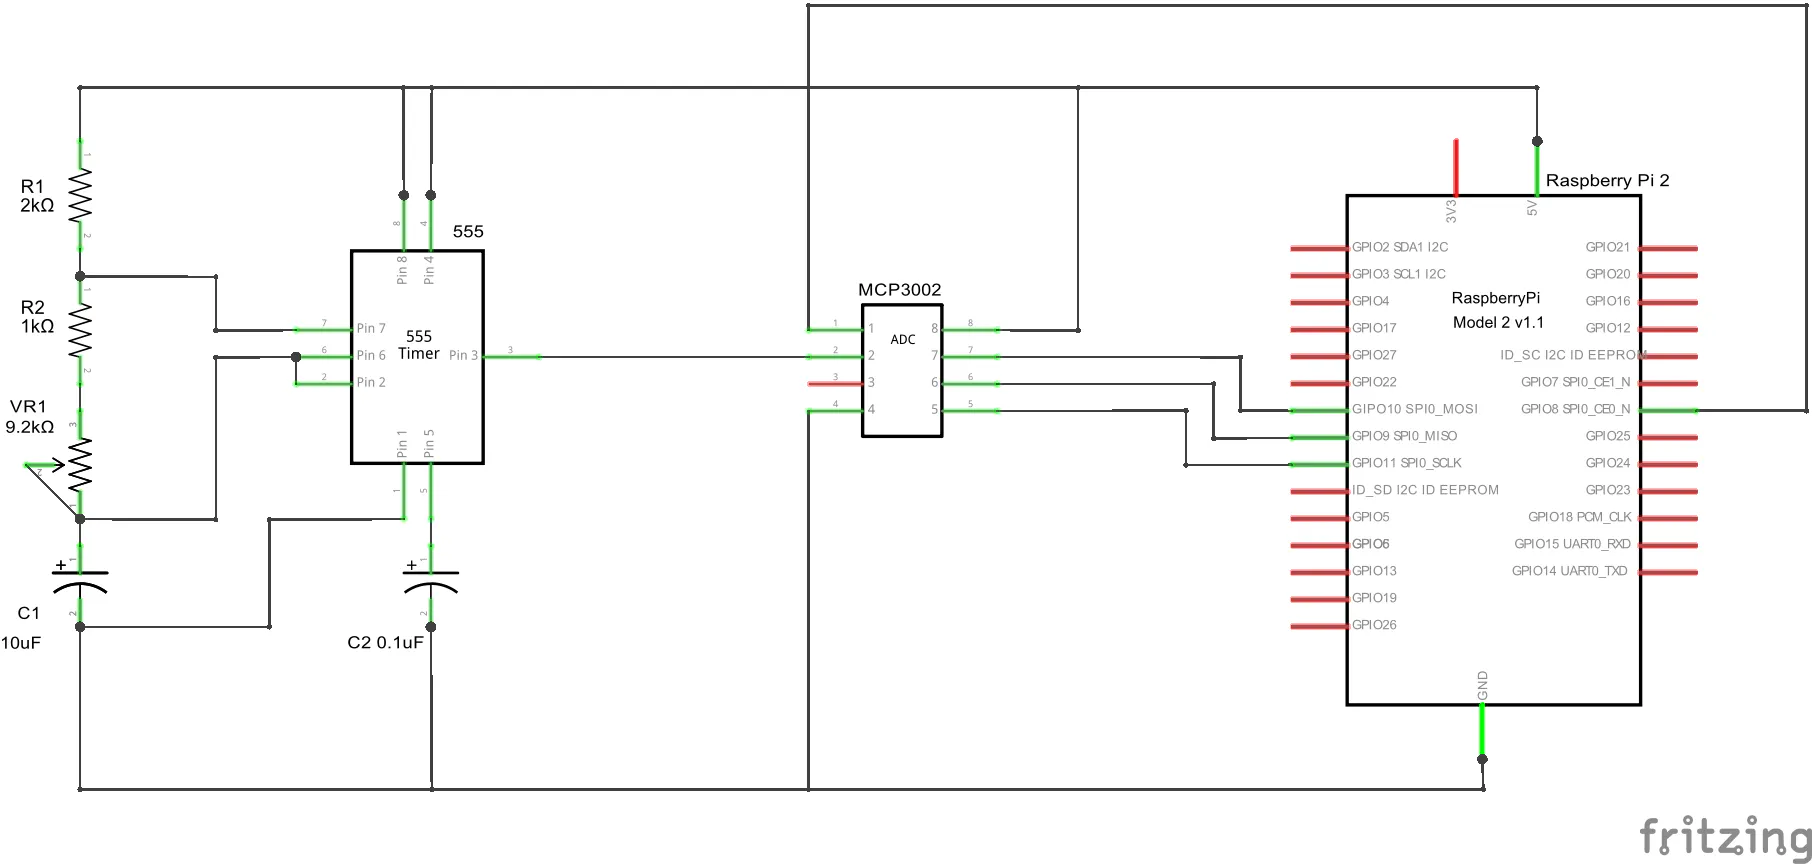
Oscilloscopes are useful in displaying various voltage waveforms. At its most basic function, it continuously scans the incoming voltage and displays it as a waveform. For this project, I built a simple 555 timer circuit to generate a square-wave waveform for my oscilloscope. There are tons of online examples of 555 circuits. I implemented the one I found here. You can see the resistor and capacitor values I used in the schematic section.
For the software, I borrowed from the Potentiometer Sensor Sample that Microsoft has on their developer site. It does a good job of initializing a couple of different ADC options. You can download my project from the GitHub link below. Open the IoTOscilloscope project in Visual Studio, set the target architecture to ARM, build, and deploy to your Raspberry Pi 2.
Features:
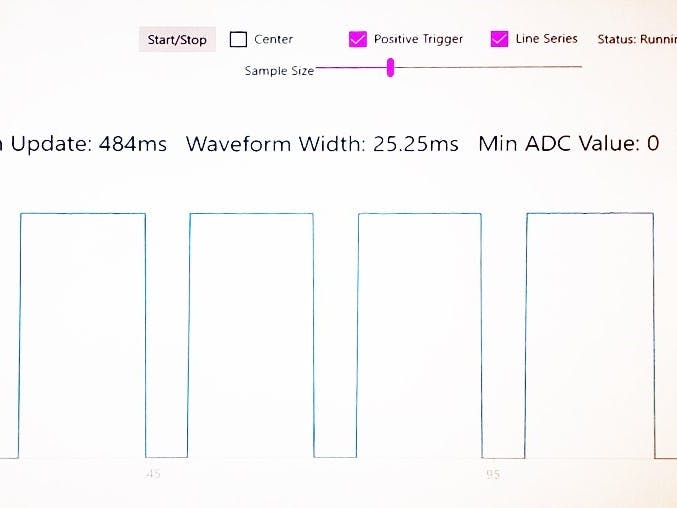
- The vertical scale is the raw ADC output. For the MCP3002 that is from 0 to 1024 (0V to 5V).
- The horizontal scale is in milliseconds.
- Start/Stop button.
- Center: This option will center the raw ADC output around 0.
- Positive Trigger: This option will change the 0 millisecond trigger for the signal between a positive to negative transition, or a negative to positive transition.
- Line Series: This option will change the graph type between a line series and a scatter point.
- Sample Size: This slider allows the user to change the number of samples acquired for each scan between 200 and 2000.
- Graph Update: This shows the number of milliseconds between successive graph updates. This value includes a built-in 250 millisecond delay to help with UI responsiveness.
- Waveform Width: Displays the number of milliseconds for the wavelength of the signal.
- Min ADC Value: Displays the minimum raw ADC value for the scan.
- Max ADC Value: Displays the maximum raw ADC value for the scan.
NOTE: The sample rate for the ADC is dependent upon the speed of processor and is not a set value. You can see this in the following screen capture of a scatter point scan.
Notice that the points are not uniform. It is dependent upon the operating system and how it handles the timeslices of capture process. The software captures each point with a timestamp.
You can see a video demonstration I give on the project below.
How that variable sample rate is handled is explained in the Code section.
I found this project to be fun and cool. It demonstrated to me that you can do a wide variety of realtime signal processings within software on a Windows IoT Core-based device. With some additional hardware to handle the data capture, you could even equal the capabilities of high-end oscilloscopes.


Comments