
![A Pho-ton of Music [Lane of Things]](https://prod.hackster-cdn.online/assets/transparent-a0c1e3063bcabc548a5f3fa7328f3c1c97f747e6e764da4c14439567baa79ae1.gif)


![A Pho-ton of Music [Lane of Things]](https://hackster.imgix.net/uploads/attachments/291468/img_20170417_152446_Gbd6WLuuT1.jpg?auto=compress%2Cformat&w=900&h=675&fit=min)
Hardware components | ||||||
| × | 1 | ||||
 |
| × | 7 | |||
 |
| × | 1 | |||
 |
| × | 1 | |||
 |
| × | 1 | |||
 |
| × | 1 | |||
Hand tools and fabrication machines | ||||||
 |
| |||||
Overiew
Our project is inspired by The Array of Things. We placed our sensor in the orchestra room to measure the correlation between sound and temperature.
We found interest in studying the relationship between temperature and sound due to Chicago being a city with fluctuating weather and Lane Tech being an old (but newly renovated) building. Nevertheless, we also had the interest in helping musical classrooms solve problems surrounding their environment.
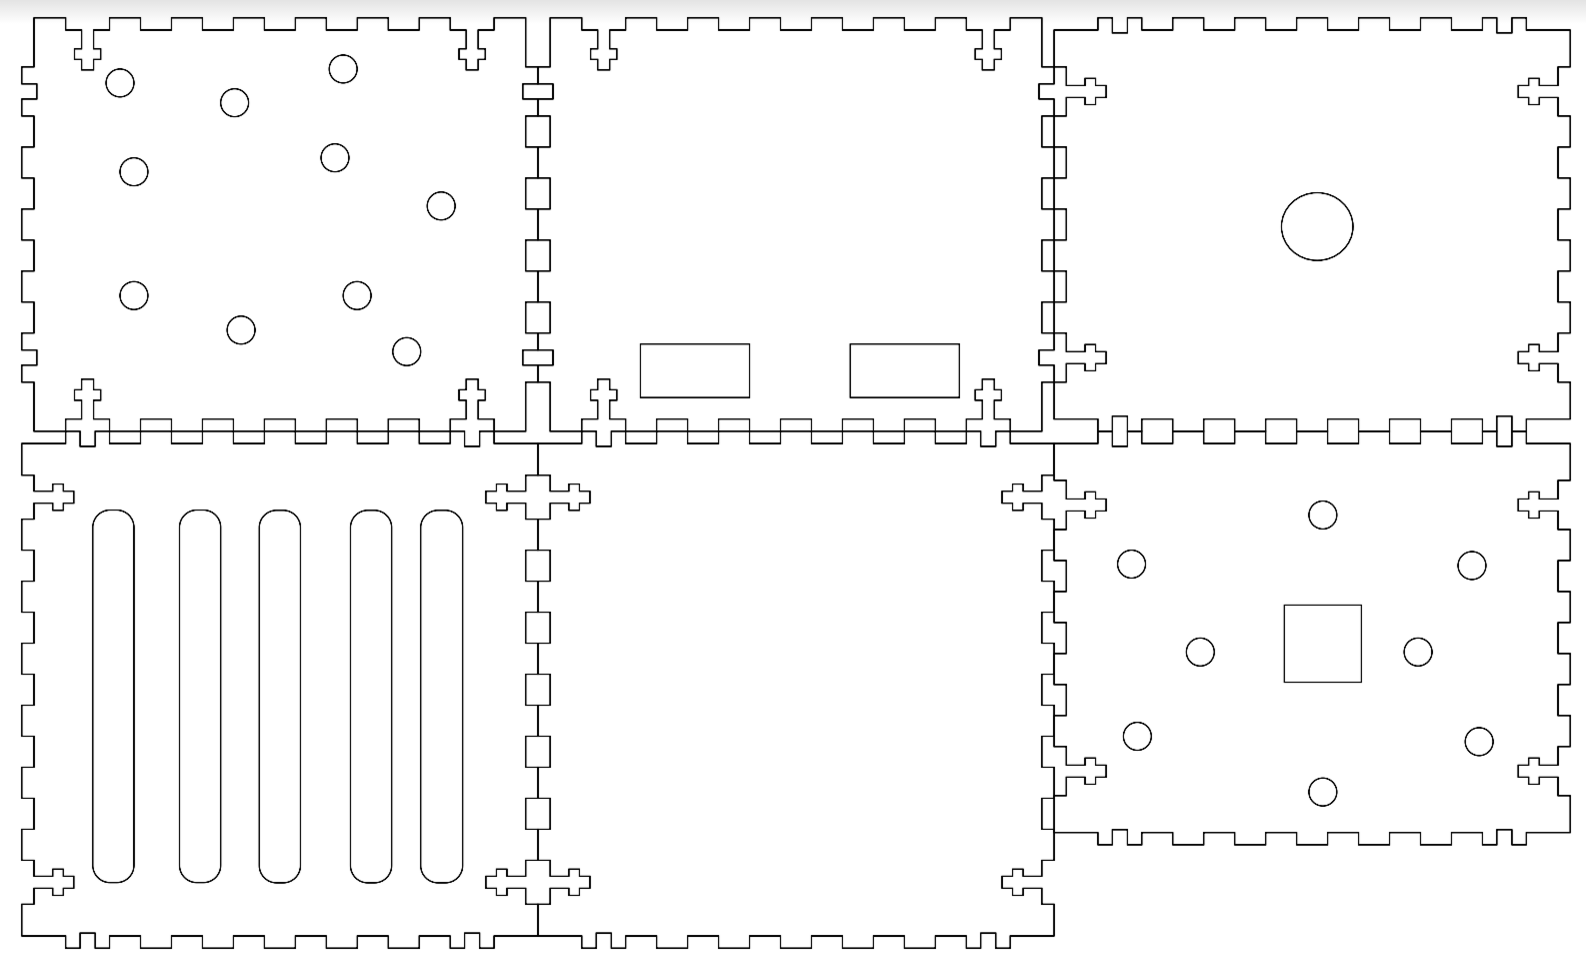
Our group decided that having a simple box would be straightforward and practical. The design originally included a cone, in which the sound was meant to be directed toward the microphone of the sensor. The cone was later removed for practicality, and the sensor was placed on a wall in which it would receive direct sound. The holes and vents were included for the temperature/ humidity sensors to accurately pick up data. The final box was made out of clear acrylic in which people can look into the box and see the entire set-up for themselves.
How did you develop / debug your code?
The code was developed with other groups who were also collecting data with sound, as for the temperature/ humidity code was given in class. There were several problems with the sound code, which ended up delaying the deployment. There was a problem in which the code was not presenting the correct data (in means of logical sound range).
What did you learn/ any Challenges?
Many challenges we faced had to do with the coding. The sound code was very complicated and it took many tries before we actually started pulling accurate data. Since we did so much trial and error with the code, the deployment of our sensor was delayed. Another obstacle we faced also ended up postponing the sensor deployment. The day before we were supposed to deploy, we came into class and found that the pins connecting the wires on our sound sensor were broken off. So, we spent the whole period re-soldering the sensor and wiring it to the breadboard. We missed at least 3-4 days of data pulling, but it all worked out in the end. The majority of our data was recorded during spring break which meant there were no classes going on. Thus, much of our data stayed constant and did not show any change.
Going into the project, a few of us did not have a lot of experience with coding so this is definitely something we extensively learned about. We learned how to use Fritzing Diagrams, successfully wire our sensors, pull data using a program called CoolTerm and also manipulate the coding behind our data spreadsheet. Overall, the entire project was a learning experience for us.
3 Temperature and Sound Graphs
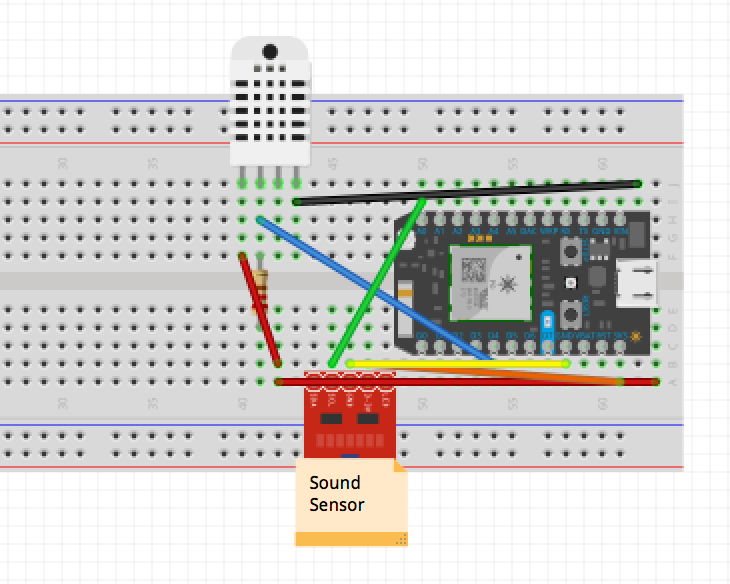
Fritzing Diagram


_3u05Tpwasz.png?auto=compress%2Cformat&w=40&h=40&fit=fillmax&bg=fff&dpr=2)
Comments