


Hardware components | ||||||
 |
| × | 1 | |||
| × | 1 | ||||
| × | 1 | ||||
| × | 1 | ||||
| × | 2 | ||||
| × | 2 | ||||
 |
| × | 3 | |||
 |
| × | 2 | |||
 |
| × | 2 | |||
 |
| × | 1 | |||
 |
| × | 1 | |||
 |
| × | 1 | |||
 |
| × | 1 | |||
| × | 2 | ||||
 |
| × | 1 | |||
Hand tools and fabrication machines | ||||||
 |
| |||||
 |
| |||||
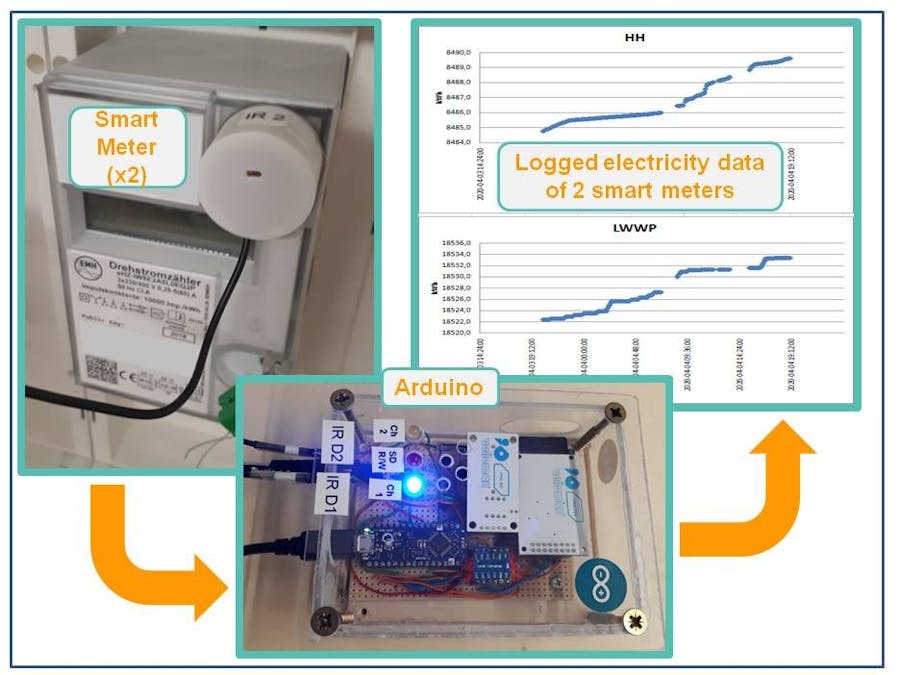
This project describes how to log electricity consumption of 2 different consumer circuits by reading the corresponding 2 smart meters ("eHz"="elektronische Haushaltszähler") simultaneously to an SD card.
It all started wanting to get a better understanding of electricity consumption w/i our household. There are 2 smart meters, the first one tracking electricity consumption of the heat pump and a second one tracking general electricity consumption (lights, stove,...).
In the www I found a project that does this job for 1 smart meter (by Volker Wegert). However that project is using an Arduino Uno and due to its memory limitations only data of 1 smart meter can be logged. Nevertheless it gave me (I'm pretty much new to Arduino, electronics and programming) a lot of insight and ideas.
During plyaing around w/ that code I stumbled across the recently released Arduino Nano Every and thought that it should be possible to achieve logging of 2 smart meters due to its much higher memory compared to Arduino Uno.
ImplementationHardware
Core of the project is an Arduino Nano Every.
To store the smart meter data, an SD card shield (Velleman VMA 304) is used. Since latter one operates at 3.3 V (higher voltages will probalby fry the SD card shield according to what I've found in the www) while Arduino output is at 5 V, a bidirectional level-shifter converting 3.3 V <-> 5 V is needed in between. (Make sure to format the SD card in FAT32 or FAT16 format, otherwise SD library SD.h cannot handle it).
Finally, to store the time of data acquisition together w/ the smart meter reading, a RTC (Real Time Clock) shield (Velleman VMA 301) is used.
The reason for choosing the above mentioned shields is simply my lack of experience and knowledge of alternatives and therefore the result of searching in the www for potential candidates. In the end they have proven to do the job, nevertheless there might be other shields or components suited better.
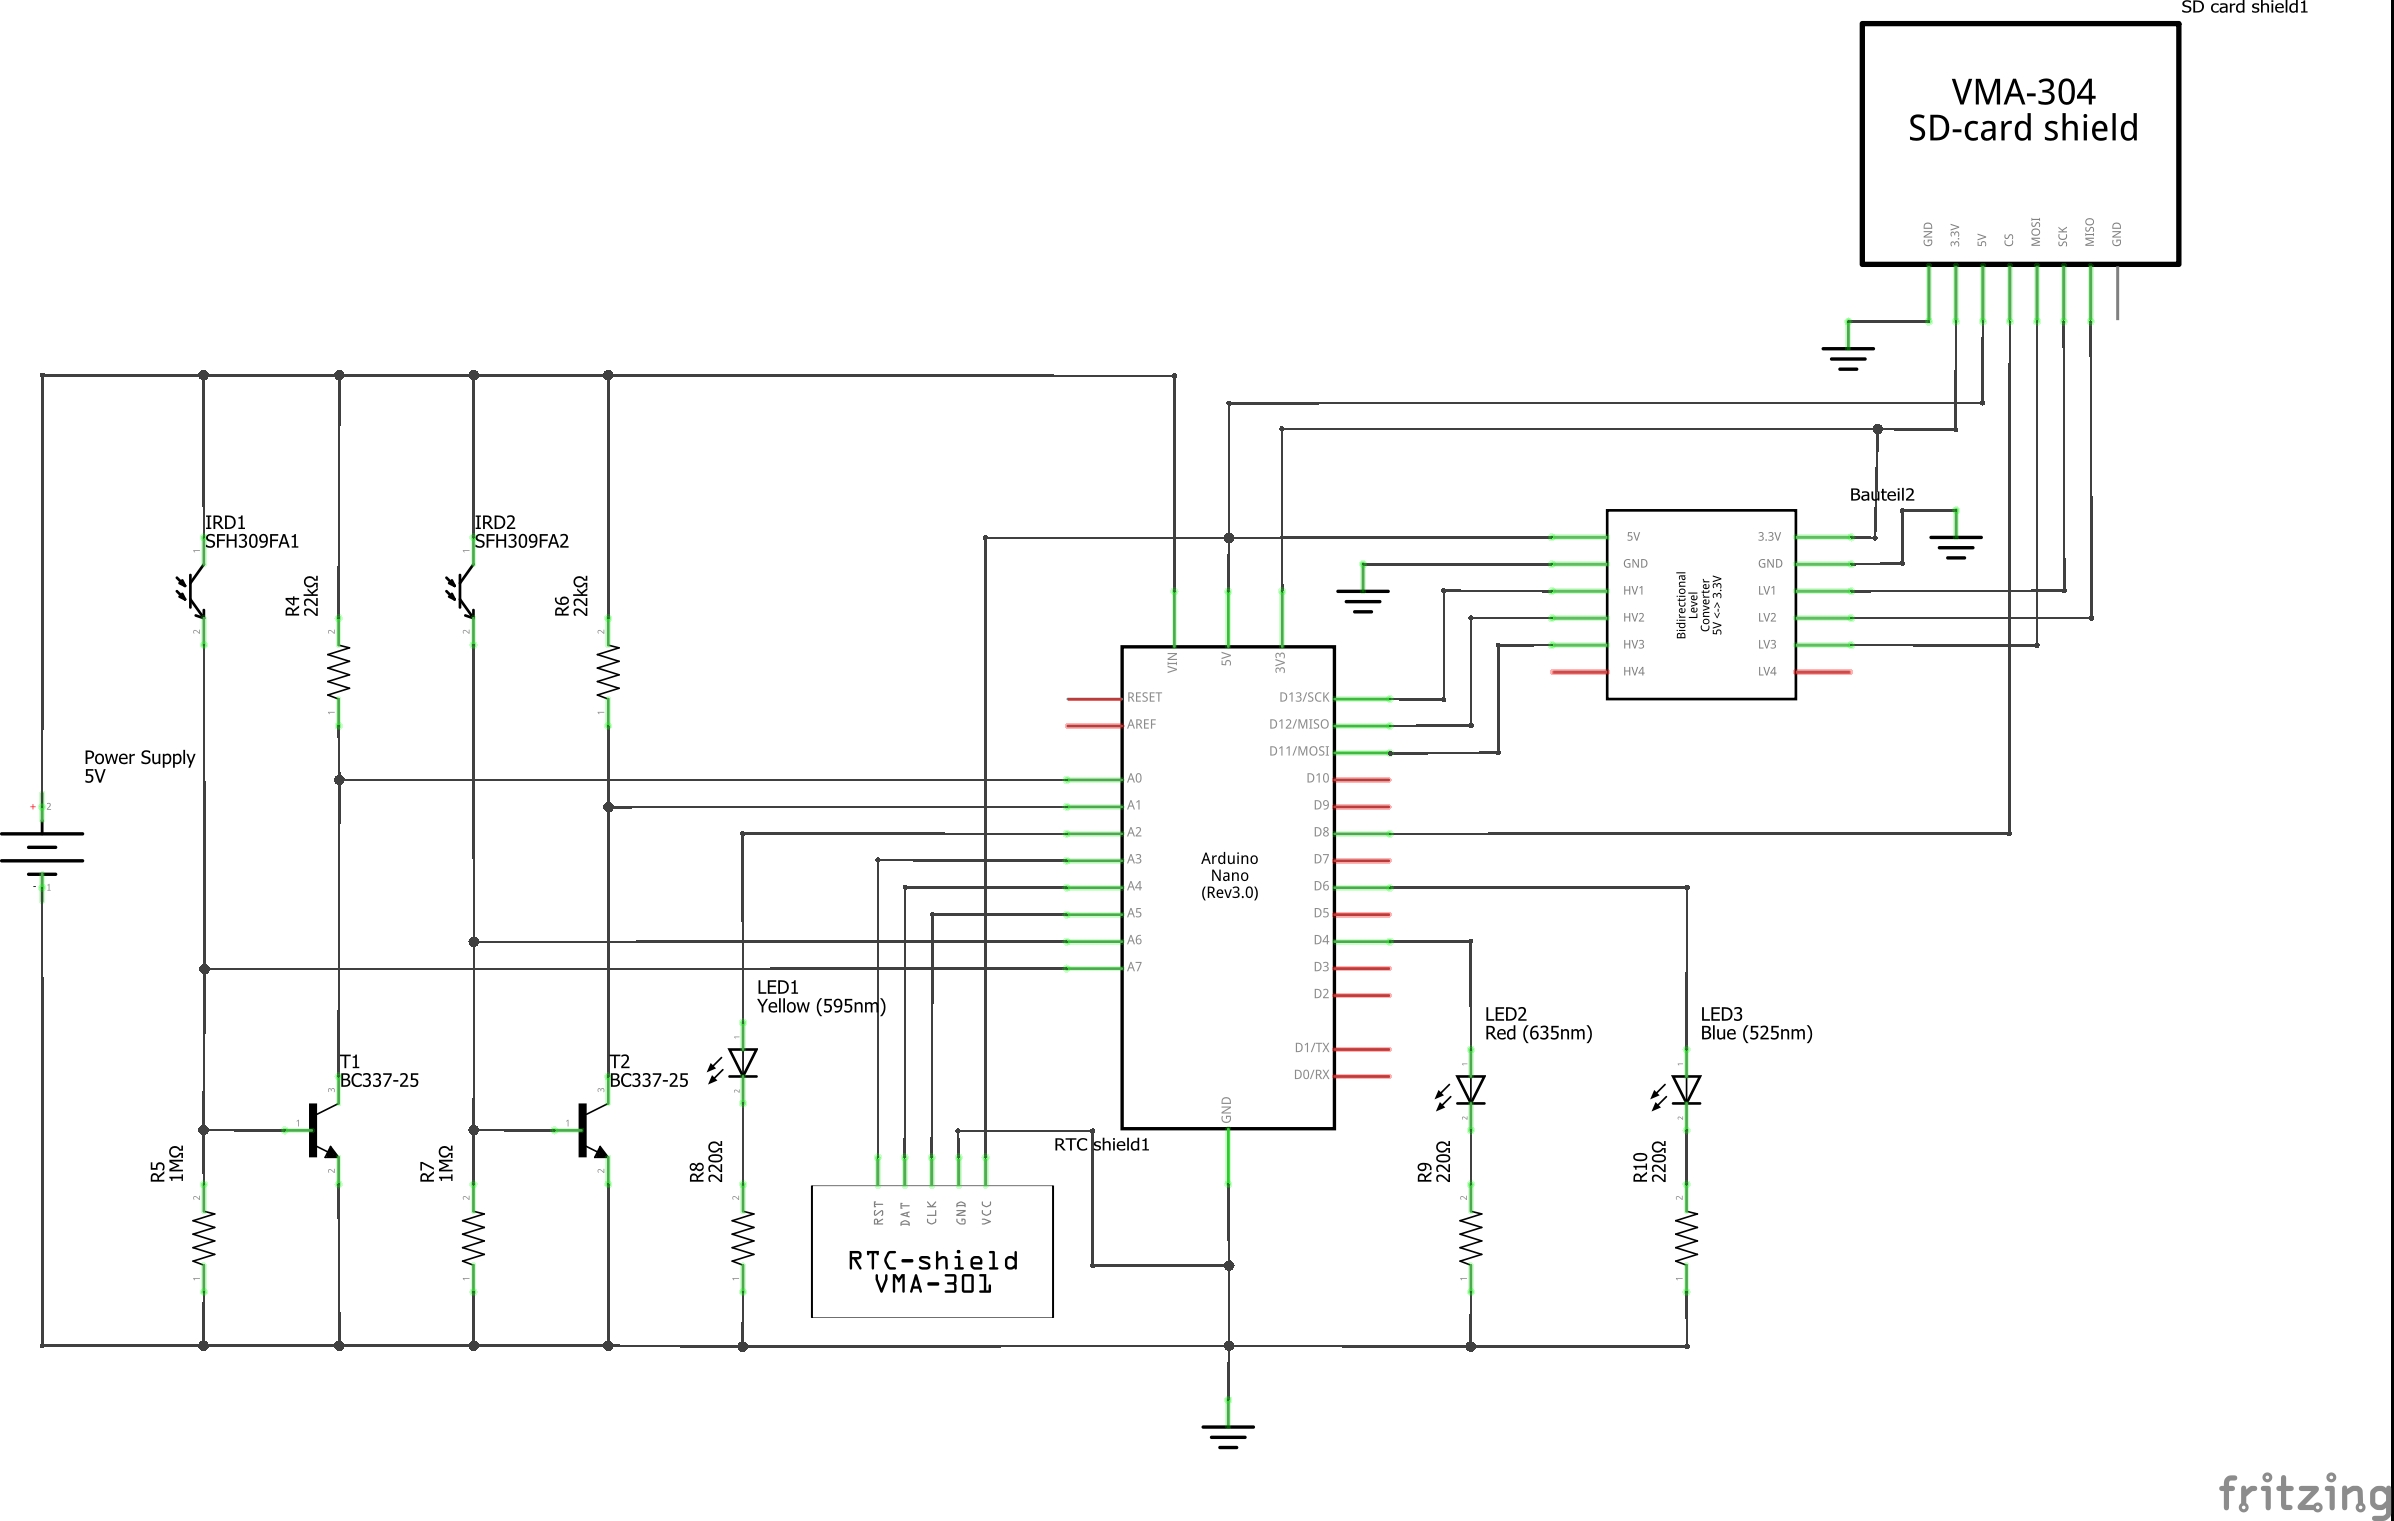
The schematics is shown below. (Hint: In the schematic it says an Arduino Nano is used. This is due to the fact that in Fritzing PC software - which I used to draw the schematic - no Arduino Nano Every was available. This does not really matter since the pinout of both is the same.)
Comparing my schematics w/ the inputs I got from Volker Wegert's project shows that I replaced some resistors:
- between IR phototransistor and GND: 15 kOhm --> 1 MOhm (470 kOhm also sufficient). Necessary to bring BC337(-25) transistor to achieve the necessary gain (probably because of lower gain of BC337-25 as compared to BC337-40 or maybe signal of IR sender of eHZ too weak or alingment IR sender to IR receiver not precise enough)
- between collector of transistor and VCC: 15 kOhm --> 22 kOhm (simply due the fact that I had 22 kOhm available)
The smart meter of type "eHZ-IW8E2A5" provides so called OBIS data every few seconds via IR pulses (no trigger necessary). The OBIS data is contained in a serial data stream in SML format. Since Arduino Nano Every hardware can only handle one single serial data stream, SoftwareSerial library is used in the code to read the separate serial data stream of each of the 2 smart meters.
The IR pulses from the eHZ sender diode are recorded by IR phototransistors (SFH309FA), (inverted and) amplified by a transistor (BC337-25) and then provided to pins A0 and A1 of the Arduino Nanao Every, respectively.
The picture below shows my early version sensor head (which gave me trouble to get sufficiently precise alignment of sender diode and receiver phototransistor) and the 3D printed sensor head (for printer file see link to Stefan Weigert's SML page provided w/i the software code). Since some smart meters require a trigger to send out SML data, the smart meter as well the IR reading head offer 2 openings. For the "eHZ-IW8E2A5", however, no trigger signal is needed, so only the IR phototransistor is mounted into 1 of the holes (the left one in the picture below; the other one remains empty).
In both cases it is easy to mount the sensor head to the smart meter, since surrounding the IR diodes of the smart meter there is a metal plate. So just add approrpiate magnets to attach your sensor head to the smart meter.
Furthermore, the unamplified IR pulses are supplied to pins A6 and A7 of the Arduino Nano Every. Those signals are not needed for recording the OBIS data. However - at least to my experience - a precise positioning of the IR phototransistors in front of the IR sender diode of the eHZ is important to get "good" serial data. To achieve this I run a very simple Arduino sketch ("IR-Diode-Schaltung_Test_NanoEvery.ino") that plots (using the Arduino IDE's Serial Plotter <Shift>+<CTRL>+<L>) the unamplified signals provided to A6 and A7 as well as the amplified signals provided to A0 and A1. By cautiously moving/rotating the sensor head w/ the built-in IR phototransistor in front of the eHZ's IR sender diode signal strength can be maximized. Effect of this alignment can be seen in the image below which gives typical example for bad and good signals. Similar behaviour could be observed for "bad" electrical contact between cable from sensor head and PCB (e.g., using inappropriate plugs/connectors - like I did in the beginning using terminal sockets. Meanwhile I replaced them by 3.5mm mono audio jacks, see photographs below). "Bad signal" leads to serial data w/ wrong header (so that it is not recognized as SML format) or even wrong content of the SML message.
Finally the following hint w/respect to hardware: I soldered socket terminal strips ("Buchsenleiste") to the PCB and later plugged in some of the components (especially the more delicate ones likte the Arduino Nano Every or the shields) to avoid damaging those delicate components during my soldering attempts.
The LEDs are used to be able to judge the status of the logger in case it is not possible to check what's going on by, e.g., using the Arduino IDE Serial Monitor (e.g., in case power is supplied via an external power supply and not via USB port of a computer).
- During initialization phase (or after pressing the Arduino Nano Every's reset button) all 3 LEDs blink 5 times in the setup section in the Arduino sketch. This primarily serves to show that the LEDs are functional (since it is used for other purpose later). It does however NOT proove that all parts of the setup were passed successfully. For the design w/ voltage monitoring the piezo speaker is triggered, too.
- During the main loop in the Arduino sketch the red LED blinks 3 times right before data is written to the SD card. This is to make sure you are not pulling out the SD card while data is written to it or disconnect power supply and thereby damaging the SD card and/or potentially loosing data.
- The other 2 LEDs (yellow and blue) are used to display if the last data for the respective smart meter was acquired successfully (3 times slow blinking; ~+1s ON time) or not (3 times fast blinking; ~0.25s ON time. Blinking frequency, i.e., ON/OFF time can be set in the software code). In case running this logger on battery power this might reduce operating time. So feel free to change software code according to your needs. I also could imagine to improve the software code by implementing a check if a button is pressed and only if that button was pressed the success or failure of the last data acquisition is displayed. But that's dreams of the future.
- For the design w/ voltage monitoring: Piezo speaker is triggered 10x after successful initialization of the SD card.
Update 2020-05-03/2020-06-09:
With respect to powering I have the following remarks:
- During setup and optimization I was powering the hardware from my computer's USB port. This seems to be fine, i.e., a lot of successfull data acquisitions
- After having achieved good results w/ that, I switched to powering via a 5V wall power supply. In the beginning (for some weeks) this also seemed to work pretty well. Suddenly (after optimizing the connectors to the IR phototransistors, see below) it was almost impossible to successfully acquire data (i.e., basically every SML stream acquired was too short or otherwise corrupted, so it became impossible to get reasonable OBIS data out of it). I have no explanation for that, because I did not change anything (at least intentionally) at the hardware level (except for the connector topic mentioned above). Maybe the wall power supply deteriorated in the meantime ? I have no proof for that, since 5V are still ok.
- Finally I used a 6V PbAcid accumulator to power the hardware. With this, the fraction of successfully acquired data went up to >>95%... If you do so, make sure that the shields are powered by the 5V output of the Arduino (and not directly conected to supply power), since otherwise you might fry some of them by the applied 6V.
- Meanwhile I added a voltmeter w/ display (triggered by a simple push button, i.e., w/o use of Arduino functionality). Goal was to be able to get an impression of the current voltage delivered by the PbAcid battery to prevent it from deep discharge (by manually removing the electronics and charging the battery). Schematics updated, also picture of display added.
UPDATE 2021-03-01:
- UPDATE 2021-03-01:the voltmeter does a good job informing about decreasing supply voltage - however only in case you regularly check it. To improve this situation I added voltage monitoring functionality. In case the supply voltage drops below a defineable value, a piezzo speaker is triggered from time to time (in a defineable time window, to, e.g., avoid being woken up during nighttime). The current supply voltage is also recorded on the SD card. Since the Arduino's analog inputs can only handle up to 5V and the PbAcid battery supply voltage is initially ~7V if fully charged, a high-ohmic voltage divider is used. It was also necessary to do some rewiring, since supply voltage is read using analog input A2 (which was used to drive one of the LEDs so far). This also required changes in the code so far. So in case you build a circuit "2eHZ_Auslesen_Schaltplan_NANO-EVERY_V03_Schaltplan.pdf", be sure to use the code "eHZ-IW8E2A5_EMLogger_ArdNanoEvery_TMG_09.ino").
Software
Pins used and libraries needed are documented w/i the SW code. The main challenge to me was finding a working library to operate the RTC shield (based on DS1302 clock chip). There are many libraries out there in the www, however almost any of them caused trouble. Link to where I found the working library is provided at the beginning of the sketch.
In the setup section it is possible set the time in the RTC shield for the first time the code is uploaded (search for "Uncomment in case"...) or to compensate for drift over time. After that first upload these lines should of course be again set as comments in the Arduino sketch because otherwise in case of uploading the sketch to the Arduino afterwards (e.g., you want to change the logging interval) the time woul be again set to the "old" value - which of cource deviates from the current real time.
The data is written to files w/ naming convention "########.csv" (w/ "#" being a number 0-9). Ideally I would expect to find only 1 file in between manually initiated resets. However I typically find several .csv files on my SD card. To me it seems that - for to me unknown reason - the Arduino from time to time resets itself, since a new output file name (increasing numbers) is only generated at the end of the setup section of the code. Sometimes I also find the logger somewhat stuck (what I observe is that none of the LEDs is blinking for quite a while), so I have o reset it manually. Any explanation or solution to this is highly welcome !
Furthemore it is possible to set the logging interval (variable: "loggingInterval"). In case you use the LEDs to display successful or unseccussful data acquisition, be aware that the time for that LED blinking w/i main loop limits the shortest logging interval (However this might not be a real problem since read out of the smart meter only every other minute should be sufficient (assuming typical energy consumption)). In addition - since after each reading ~3s for the blinking (per channel) is needed - after N readings the smart-meter-time deviates from eral time by N x 3 s. After about 1/2 year of operation I realizeed that this added up to a deviation of a few days... These might be good reasons to remove the LED blinking from the code.
In the original code from Volker Wegert 2 checks w/ respect to integrity of the SML data were implemented (1. Header of acquired data in SML format ? 2. Buffer overflow ?). However I got still many bad readings from the smart meters (probably due to imperfection in my hardware). Examining this I found that the acquired SML data passed both checks mentioned above, however the total SML message length was very often way shorter than expected. So I added another check to make sure the smart meter reading is extracted from the SML data only in case the buffer lenght was o.k. (397 bytes in my case). This might be different in your application, since as far as I understood the content of the SML protocol and therefore the extractable OBIS data is set by your MSB ("Messtellenbetreiber"), i.e., the company providing the electricity meter. How long your protocol is can be figured out easily by checking the output in the Arduino IDE's Serial Monitor (There are many Serial.print in the Arduino sketch, just play around with those).
To extract the smart meter reading I did not implement an SML parser or similar. I analysed the SML data in a spread sheet using the guide by Stefan Weigert (Link see Arduino sketch) to identify the position in the buffer where the acquired SML data is stored. This - together w/ functional hardware and good alingment of the sensor head - gives me a percentage of >>95% "good"/plausible smart meter readings. This could probably be improved by implementing another check, e.g., if the last acquired smart meter reading is only a few Wh higher than the reading before. Again, dreams of the future...
In case you upgrade/optimize the software I'd appreciate if you let me know about that.
Result
Finally let me share how my logging device looks like.
That's all I can share, folks. I hope my explanations are clear and valuable to help you in case you plan to do a similar project. In case of questions feel free to contact me. I'll do my best to answer your questions. This might take some time, though, so please don't feel offended in case of some delay.


Comments